Just how much do countries rely on groundwater point sources for their drinking water?

Preliminary analysis of census and national survey data from the 2019 Joint Monitoring Programme, by Dr Kerstin Danert

An important issue for those of us that think a lot about groundwater is the extent that various countries rely on it for their drinking water.

The data presented in the table below has been prepared from the 2019 data published by the Joint Monitoring Programme (JMP) of the World Health Organisation (WHO) and UNICEF (see https://washdata.org/data). Each country has an associated Country File (an excel spreadsheet) with collated data on Water, Sanitation and Hygiene use. This data is gathered from national censuses as well as household surveys such as the Demographic and Health Surveys (DHS) and Multiple Indicator Cluster Surveys (MICS) and many others. The country files given excel spreadsheets on the JMP website (not to mention the underlying surveys) contain a wealth of data!

The table below shows the percentage of the population that rely on groundwater point sources as their main source of drinking water for every country and territory for the most recent year for which census or survey data is available. The data is presented for urban, rural and total populations.  Groundwater point sources include protected and unprotected wells and springs, as well as tube wells and boreholes.  Countries may have slightly different nomenclature for the above terms, but these are harmonised in the country tables produced by the JMP.

It is important to note that the data only includes point sources.  Water that is bought from vendors, sold in bottles/sachets or transmitted in pipes may also originate from groundwater, but this information is not generally collated by the censuses or surveys and thus cannot be reflected.  Consequently, the actual dependency of a particular on groundwater for drinking may be considerably higher. In addition, national governments may also make calculations based on the infrastructure available and assumed number of users per source. Due to the different methods of data collection and calculation, these estimates may differ from that collected by the household survey or census.

Please note that the analysis below has not been peer-reviewed, and so if you are intending to use the data, please do check in the respective JMP country file.  You can access Country Files on: https://washdata.org/data. Click on map to select country, download “Country file” and open the “Water Data” tab. In case you spot any mistakes in the table below, please respond in the comments in the blog below or contact the author directly, via rwsn@skat.ch.

Table 1 Groundwater point source as main drinking water source (% of the population classified as urban, rural and total)

Urban Rural Total
Country Census/ Survey Year Ground-water point source as main drinking water source (% of the urban pop.) Census/ Survey Year Ground-water point source as main drinking water source (% of the rural pop.) Census/ Survey Year Ground-water point source as main drinking water source (% of the total pop.)
Afghanistan 2017 57.3% 2017 71.5% 2017 68.1%
Albania 2012 6.4% 2012 14.7% 2012 10.2%
Algeria 2013 6.6% 2013 19.6% 2013 11.3%
American Samoa 2010 0.5%
Andorra 2005 6.6%
Angola 2016 17.7% 2016 43.0% 2016 26.8%
Anguilla 2009 0.7% 2009 0.7%
Antigua and Barbuda 2011 0.4%
Argentina 2013 9.1% 2010 37.7% 2010 15.0%
Armenia 2016 0.1% 2016 2.6% 2016 1.1%
Aruba 2010 1.3%
Australia 2013 0.1% 2013 1.1% 2013 0.5%
Azerbaijan 2017 0.1% 2017 12.1% 2017 5.4%
Bahamas 2010 2.9%
Bahrain 1995 1.4%
Bangladesh 2016 66.4% 2016 94.7% 2016 84.9%
Barbados 2010 0.1% 2012 0.1%
Belarus 2012 2.7% 2012 32.9% 2012 11.1%
Belize 2016 0.3% 2016 4.1% 2016 2.5%
Benin 2014 39.4% 2014 56.8% 2014 48.9%
Bhutan 2017 0.3% 2017 0.6% 2017 0.5%
Bolivia (Plurinational State of) 2017 5.0% 2017 42.2% 2017 16.5%
Bosnia and Herzegovina 2012 3.6% 2012 11.4% 2012 8.9%
Botswana 2017 0.1% 2017 14.9% 2017 5.3%
Brazil 2017 0.4% 2017 8.4% 2017 1.6%
British Virgin Islands 2010 1.9%
Brunei Darussalam 2011 0.1% 2011 0.1% 2011 0.1%
Bulgaria 2001 0.4% 2001 2.7% 2001 1.1%
Burkina Faso 2017 17.1% 2017 85.6% 2017 72.9%
Burundi 2017 8.6% 2017 68.1% 2017 61.5%
Cabo Verde 2007 0.1% 2012 15.1% 2012 5.1%
Cambodia 2016 13.5% 2016 47.2% 2016 40.2%
Cameroon 2014 35.5% 2014 74.1% 2017 50.0%
Canada 2011 0.1% 2011 0.7% 2011 0.3%
Caribbean Netherlands 2001 27.3%
Cayman Islands 2010 4.9% 0.0% 2010 4.9%
Central African Republic 2010 49.1% 2010 92.1% 2010 75.4%
Chad 2015 48.0% 2015 82.4% 2015 74.6%
Chile 2017 0.6% 2017 4.0% 2017 2.4%
China 2013 7.4% 2013 43.1% 2016 22.4%
Colombia 2018 0.4% 2018 13.7% 2018 3.3%
Comoros 2012 5.1% 2012 21.3% 2012 16.2%
Congo 2015 24.9% 2015 65.7% 2015 38.3%
Cook Islands 2011 0.0%
Costa Rica 2018 0.0% 2018 0.5% 2018 0.2%
Côte d’Ivoire 2017 33.9% 2017 71.0% 2017 49.5%
Croatia 2003 3.3% 2003 18.0% 2003 20.0%
Cuba 2011 13.5% 2014 41.9% 2011 18.2%
Curaçao 2011 0.9%
Czechia 2003 1.5% 2003 7.1%
Democratic People’s Republic of Korea 2017 17.1% 2017 58.1% 2017 33.1%
Democratic Republic of the Congo 2014 33.0% 2014 79.4% 2014 63.5%
Djibouti 2017 0.6% 2017 55.5% 2017 10.9%
Dominica 2001 0.6% 2001 6.3% 2009 0.3%
Dominican Republic 2016 0.1% 2016 2.3% 2016 0.7%
Ecuador 2017 1.1% 2017 17.1% 2017 6.1%
Egypt 2017 0.4% 2017 2.1% 2017 1.4%
El Salvador 2017 3.0% 2017 12.3% 2017 6.6%
Equatorial Guinea 2011 44.7% 2011 51.9% 2011 48.4%
Eritrea 2010 3.4% 2010 36.0% 2010 24.6%
Estonia 2010 1.7% 2010 18.8% 2010 6.7%
Eswatini 2014 3.7% 2014 31.5% 2014 24.0%
Ethiopia 2017 5.1% 2017 62.3% 2017 52.0%
Falkland Islands (Malvinas) 2016 43.7%
Fiji 2014 1.1% 2014 13.6% 2014 7.2%
Finland 1999 1.0% 2005 5.0% 2005 1.0%
French Guiana 1999 5.0% 1999 6.0% 2015 13.5%
Gabon 2013 3.3% 2013 37.8% 2013 8.2%
Gambia 2013 14.4% 2013 60.0% 2013 32.6%
Georgia 2017 4.9% 2017 46.9% 2017 22.2%
Germany 2007 0.8% 2007 0.8% 2007 0.0%
Ghana 2017 11.3% 2017 56.7% 2017 36.0%
Greece 2001 0.2% 2001 3.8%
Grenada 1999 4.0% 1999 18.0%
Guadeloupe 2006 0.8% 2006 0.3% 2006 0.8%
Guam 2010 0.1%
Guatemala 2015 5.0% 2015 19.6% 2015 13.4%
Guinea 2016 32.8% 2016 75.3% 2016 59.0%
Guinea-Bissau 2014 41.0% 2014 78.0% 2014 61.7%
Guyana 2014 1.3% 2014 5.5% 2014 4.4%
Haiti 2017 8.1% 2017 56.5% 2017 37.5%
Honduras 2017 2.0% 2017 4.2% 2017 3.0%
Hungary 1990 5.0% 1990 28.9%
India 2016 23.8% 2016 63.7% 2016 50.5%
Indonesia 2018 35.2% 2018 66.9% 2018 49.6%
Iran (Islamic Republic of) 2015 1.8% 2015 4.6% 2015 0.8%
Iraq 2018 0.5% 2018 4.6% 2018 1.8%
Ireland 2006 0.0% 2006 0.5%
Italy 2001 3.9%
Jamaica 2014 0.0% 2014 1.2% 2014 0.6%
Jordan 2016 0.3% 2016 0.7% 2016 0.4%
Kazakhstan 2015 3.2% 2015 21.0% 2015 11.5%
Kenya 2017 21.2% 2017 54.1% 2017 46.2%
Kiribati 2014 0.0% 2014 0.0% 2014 0.0%
Kyrgyzstan 2014 1.1% 2014 11.3% 2014 8.1%
Lao People’s Democratic Republic 2017 9.0% 2017 46.0% 2017 34.7%
Latvia 2003 2.4% 2003 12.5%
Lebanon 2016 10.9%
Lesotho 2015 5.5% 2015 27.8% 2015 21.4%
Liberia 2016 58.7% 2016 74.7% 2016 65.3%
Libya 1995 35.8% 1995 26.9% 2014 19.1%
Madagascar 2016 24.5% 2016 61.6% 2016 57.6%
Malawi 2017 16.3% 2017 86.0% 2017 73.8%
Malaysia 2003 0.8% 2003 6.7%
Maldives 2014 0.1% 2014 0.2% 2017 0.5%
Mali 2018 19.5% 2018 72.3% 2018 56.2%
Marshall Islands 2017 0.2% 2017 2.5% 2017 0.6%
Martinique 1999 0.5% 2015 0.4%
Mauritania 2015 6.5% 2015 49.4% 2015 29.1%
Mayotte 0.0% 2013 2.5%
Mexico 2017 0.8% 2017 9.5% 2017 2.8%
Micronesia (Federated States of) 2010 3.6% 2010 10.7% 2010 9.1%
Mongolia 2016 12.8% 2016 52.7% 2016 25.8%
Montenegro 2013 5.1% 2013 29.2% 2013 14.1%
Montserrat 1998 2.0% 1998 100.0% 2001 0.1%
Morocco 2012 1.0% 2012 27.2% 2012 10.2%
Mozambique 2015 21.4% 2015 62.5% 2015 49.6%
Myanmar 2016 34.3% 2016 74.8% 2016 64.0%
Namibia 2016 0.6% 2016 23.4% 2016 11.8%
Nauru 2011 1.6% 2011 0.0% 2011 1.6%
Nepal 2016 41.8% 2016 46.8% 2016 44.4%
New Caledonia 2014 3.1%
Nicaragua 2014 4.4% 2014 59.9% 2016 21.4%
Niger 2017 33.9% 2017 71.0% 2017 49.5%
Nigeria 2018 45.3% 2018 73.1% 2018 60.0%
Niue 1999 20.0% 2010 0.0%
North Macedonia 2011 1.5% 2011 15.1% 2011 7.7%
Northern Mariana Islands 2000 1.3% 0.0% 2010 1.1%
Oman 2014 5.1% 2014 10.0% 2014 6.4%
Pakistan 2016 30.4% 2016 44.0% 2016 39.1%
Panama 2015 0.7% 2015 14.6% 2017 0.0%
Papua New Guinea 2017 2.8% 2017 7.5% 2017 7.1%
Paraguay 2017 2.1% 2017 9.2% 2017 4.8%
Peru 2017 1.5% 2017 11.1% 2017 3.8%
Philippines 2017 8.4% 2017 37.6% 2017 23.9%
Portugal 2001 0.1% 2001 0.7%
Puerto Rico 1995 1.8%
Republic of Korea 2015 1.0%
Republic of Moldova 2012 16.9% 2012 65.1% 2012 47.1%
Réunion 2015 0.2%
Romania 1994 11.3% 1994 81.0%
Russian Federation 2009 3.4% 2009 19.5% 2009 8.6%
Rwanda 2017 17.2% 2017 58.4% 2017 50.4%
Saint Kitts and Nevis 1999 27.0% 1999 27.0% 2007 0.3%
Saint Lucia 2012 0.5% 2012 2.0% 2012 1.6%
Saint Vincent and the Grenadines 1999 20.0% 2012 0.1%
Samoa 2016 2.6% 2016 5.6% 2016 5.0%
Sao Tome and Principe 2010 4.5% 2010 11.7% 2010 6.9%
Saudi Arabia 2017 0.2%
Senegal 2017 7.2% 2017 35.0% 2017 22.5%
Serbia 2014 2.4% 2014 11.7% 2014 6.2%
Sierra Leone 2017 54.7% 2017 68.9% 2017 62.6%
Sint Maarten (Dutch part) 2011 7.4%
Slovakia 2003 2.3% 2003 2.3% 2011 13.1%
Solomon Islands 2015 8.6% 2016 27.6% 2015 17.5%
Somalia 2017 9.5% 2017 60.5% 2017 34.1%
South Africa 2017 0.5% 2017 10.1% 2017 3.8%
South Sudan 2017 66.5% 2017 80.1% 2017 77.3%
Spain 2003 0.6% 2003 0.3%
Sri Lanka 2016 17.3% 2016 51.0% 2016 45.3%
Sudan 2014 2.2% 2014 13.2% 2014 9.8%
Suriname 2017 3.1% 2017 5.4% 2017 3.8%
Syrian Arab Republic 2018 4.2% 2018 11.6% 2018 8.4%
Tajikistan 2017 5.2% 2017 18.7% 2017 15.4%
Thailand 2016 1.8% 2016 6.2% 2016 4.2%
Timor-Leste 2016 20.0% 2016 33.6% 2016 29.9%
Togo 2017 36.6% 2017 61.2% 2017 51.8%
Tonga 1999 28.0% 1999 24.0% 1996 1.7%
Trinidad and Tobago 2011 0.9% 2011 1.0% 2011 0.9%
Tunisia 2015 0.5% 2015 10.8% 2015 3.7%
Turkey 2013 5.0% 2013 40.0% 2013 13.0%
Turkmenistan 2016 4.4% 2016 34.3% 2016 22.6%
Turks and Caicos Islands 1999 22.0% 1999 40.0% 2012 1.7%
Tuvalu 2007 1.7% 2007 0.5% 2007 1.1%
Uganda 2017 35.8% 2017 79.6% 2017 71.9%
Ukraine 2018 11.5% 2018 61.2% 2018 27.8%
United Arab Emirates 2003 0.2% 2018 0.1%
United Republic of Tanzania 2017 19.4% 2017 50.5% 2017 41.2%
United States of America 2015 3.0% 2015 45.2% 2015 11.1%
Uruguay 2017 0.0% 2017 3.1% 2017 0.2%
Uzbekistan 2015 6.9% 2015 22.7% 2015 14.2%
Vanuatu 2016 1.6% 2016 4.8% 2016 4.0%
Venezuela (Bolivarian Republic of) 2011 4.3% 2011 25.6% 2011 6.8%
Viet Nam 2016 19.5% 2016 57.2% 2016 45.2%
West Bank and Gaza Strip 2017 1.2% 2017 3.2% 2017 1.5%
Yemen 2013 2.3% 2013 43.1% 2013 31.6%
Zambia 2015 26.7% 2015 76.8% 2015 55.8%
Zimbabwe 2017 11.1% 2017 77.5% 2017 57.0%

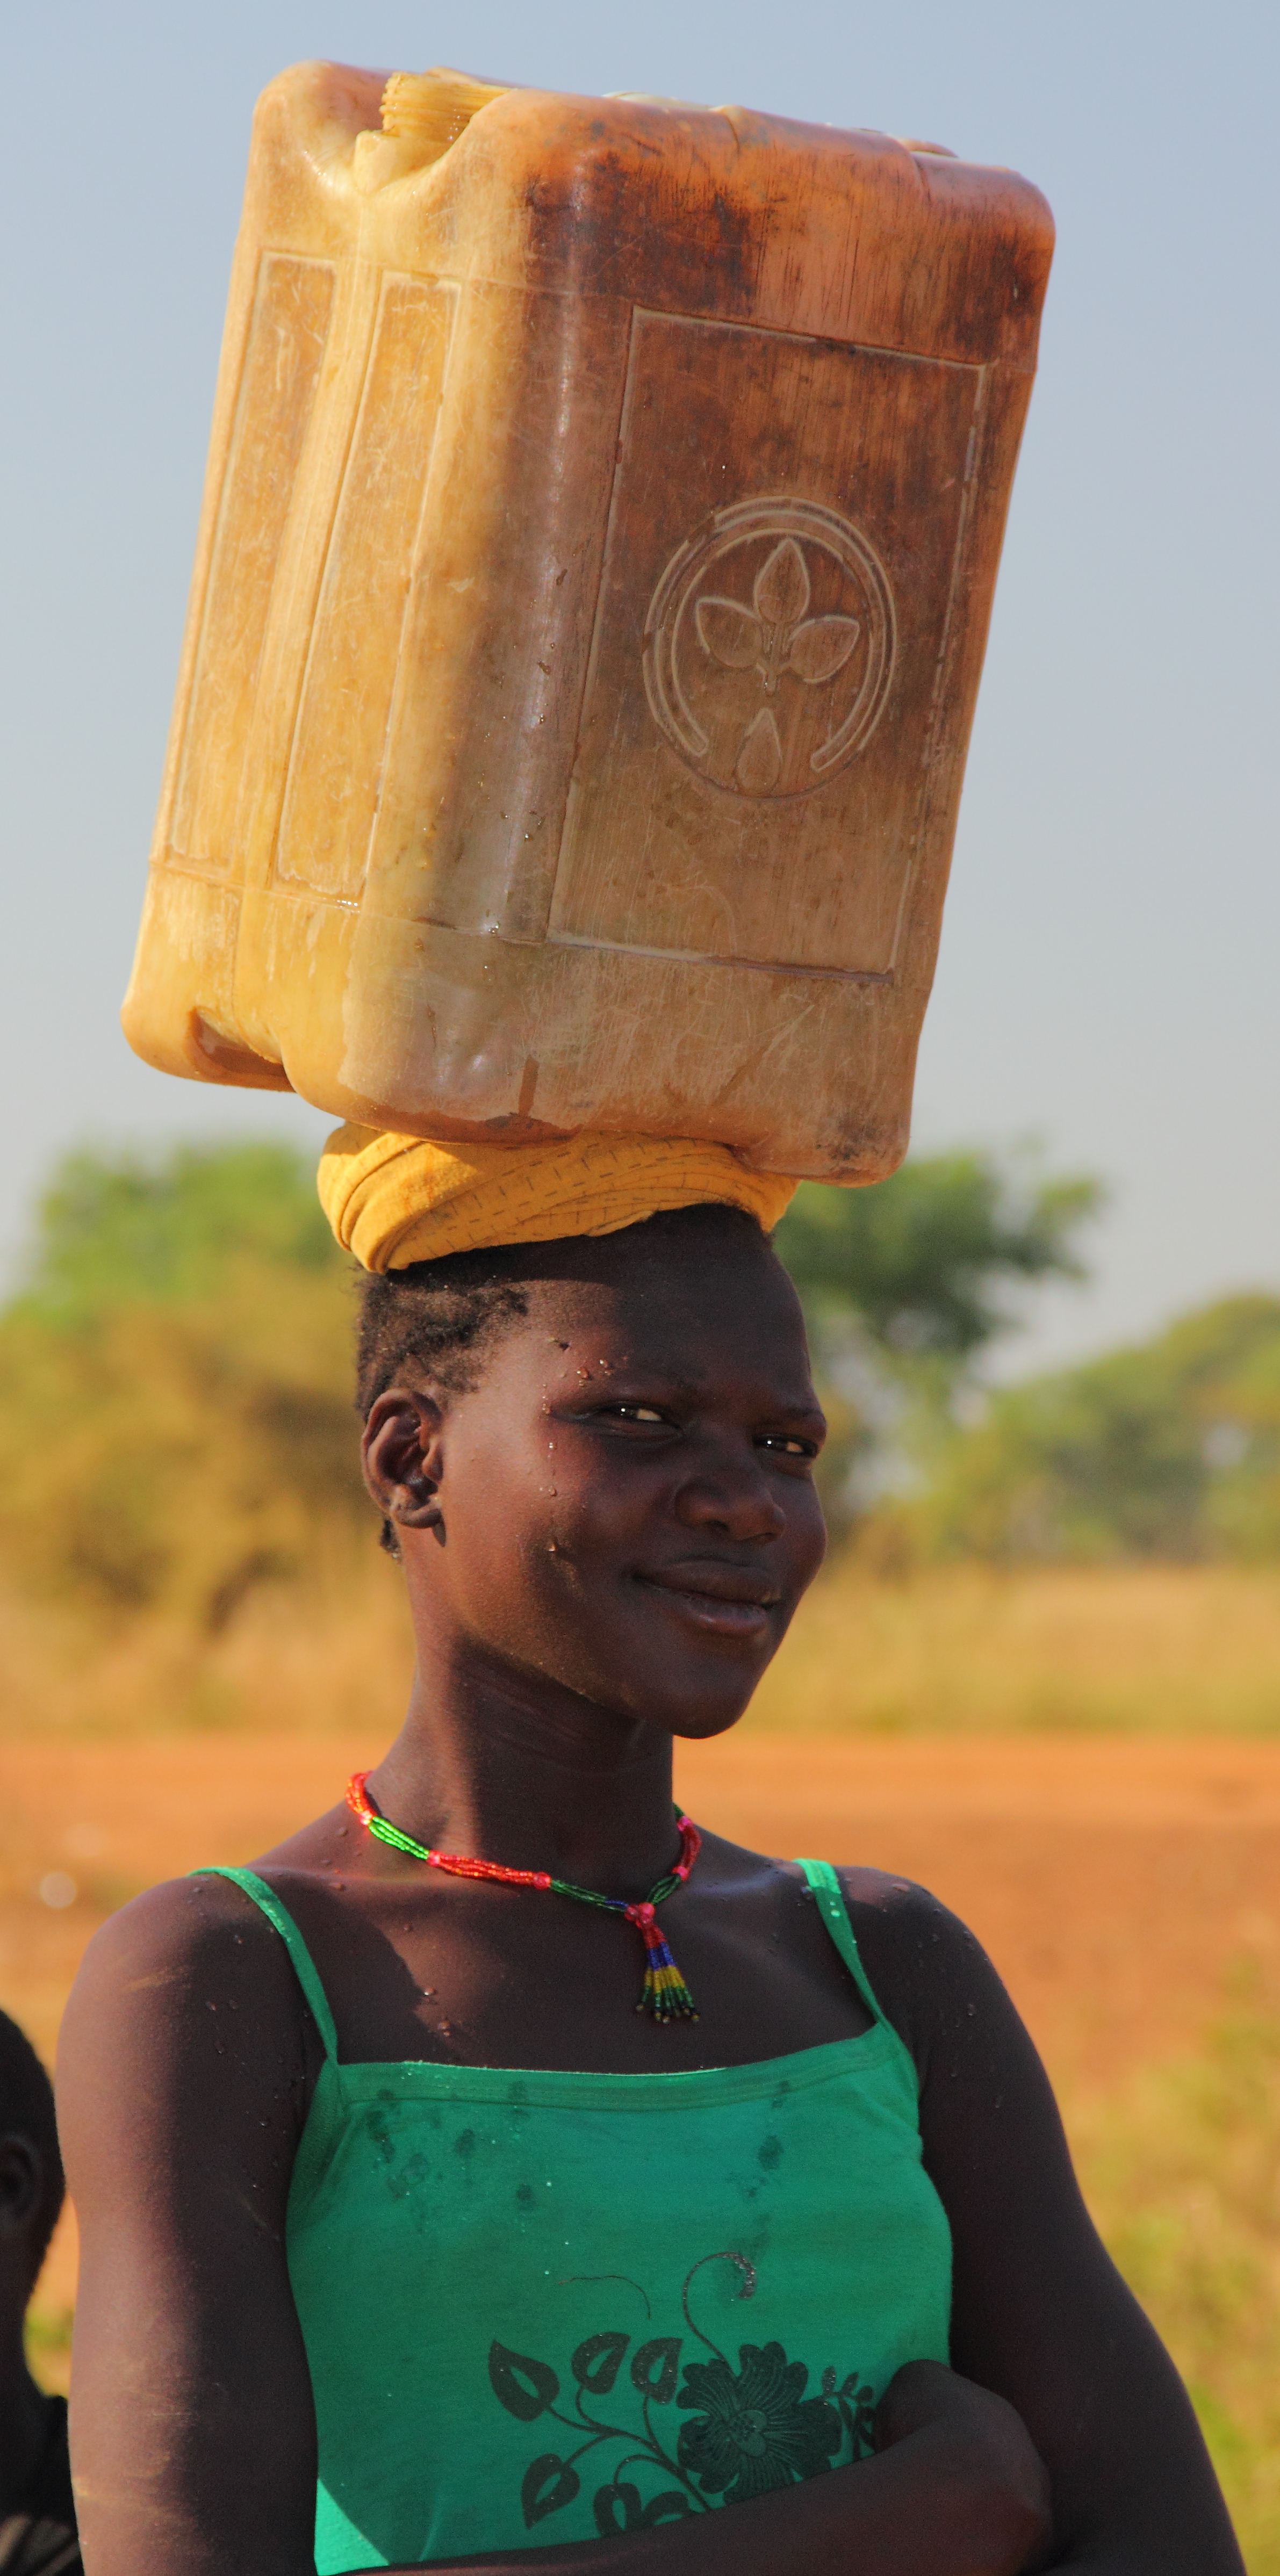
Photo:  Groundwater provides over 80% of the rural population with its main source of drinking water in South Sudan. Photo taken in 2014 in Northern Bahr el Ghazal by Kerstin Danert.


New JMP report offers fresh insights into rural water progress and challenges

The new JMP report is out with WASH data up to 2017! This is an initial look at some key points relating to rural water supply

The WHO/UNICEF Joint Monitoring Programme (JMP) is one of the central data and analysis resources for the WASH sector and each new report and data update is generally grabbed eagerly by WASH data geeks, like me.

This being RWSN, I’m specifically interested in rural water supply and what I present below is a hasty digest of some key facts and figures in the latest 2019 JMP report specifically relating to rural drinking water access.

I’m sure other WASH bloggers will also add the analysis, but I found the stuff on inequalities very interesting and useful. Some things that jumped out at me include:

  • What can we learn from Paraguay, Morocco and other countries that have made good progress?
  • Rural water supply challenges are not just about Sub-Saharan Africa: Papua New Guinea, the Solomon Islands, Fiji, Jamaica, Nicaragua and others are going backwards; and in terms of absolute numbers of people, China, India, Indonesia and Pakistan still have millions of rural people
  • Lower wealth quintiles often get left behind, but not always.
  • The new 3 elements of “Safely Managed” water are interesting and highlight an urgent need for systematic water quality monitoring – which a new RWSN Topic this year, as part of the Mapping & Monitoring Theme, thanks to our friends at the University of North Carolina.

Global Headline Facts & Figures

Here are some nuggets that will doubtless be seen in powerpoint presentations, funding proposals and journal papers over the coming year:

  • “2000-2017: Rural coverage of safely managed services increased from 39% to 53%. The gap between urban and rural areas decreased from 47 to 32 percentage points.”
  • “In 2017: 5.3 billion people used safely managed services. An additional 1.4 billion used at least basic services. 206 million people used limited services, 435 million used unimproved sources, and 144 million still used surface water.”
  • “46 out of 132 countries are on track to achieve ‘nearly universal’ basic water services by 2030, but rural areas and the poorest wealth quintiles have furthest to go”
  • “The greatest increase was recorded in Sub-Saharan Africa, where a quarter of the current population has gained access to at least basic drinking water since 2000”
  • In 2017: Eight out of ten people still lacking even basic services lived in rural areas. Nearly half lived in Least Developed Countries
  • “207 million people still used sources where water collection exceeded 30 minutes. Two thirds (135 million) of these people lived in countries in Sub-Saharan Africa but six out of eight SDG regions contained at least one country where >10% of the population used limited water services in 2017. The burden of water collection falls disproportionately on women.”

The report also reminds us that WASH is not just about SDG6, there are direct and indirect references in:

  • SDG 1.4 (No Poverty) its indicator 1.4.1 “Proportion of population living in households with access to basic services (including access to basic drinking water, basic sanitation and basic handwashing facilities)”
  • SDG 4.a (Education) and its indicator: 4.a.1 Proportion of schools with access to… (e) basic drinking water, (f) single-sex basic sanitation facilities, and (g) basic handwashing facilities
  • SDG 3.8 (Health) and its indicator on proportion of health care facilities with basic WASH services.

Since the emergence of SDG6.1 there has been a question about what “Safely Managed” water means. Well now there is some data available of the three elements chosen by the JMP team:

  • “Accessible on premises”
  • “Available when needed”
  • “Free from contamination”

However, there is only data for 14 countries for all three of these, but from those: “Between 2000 and 2017, water quality in rural areas improved from 42% to 53% free from contamination”

Regional/Country Progress and inequalities

Without doubt, the rural water supply star country is Paraguay: “Paraguay increased rural coverage of basic water from 53% to 99% and reduced the gap between richest and poorest by over 40 percentage points.”

Elsewhere:

  • “In almost all countries, service levels are higher in urban areas than in rural areas, but different patterns of inequality are observed.”
  • “In Latin America and the Caribbean, 12% of the rural population lacked basic water services in 2017, compared to 29% in 2000”
  • “In Haiti rural basic water coverage has increased among the richest but decreased among the poorest thereby widening the gap between them”
  • “In Nicaragua, rural basic water coverage has decreased among both groups.”
click to expand

Country progress to achieving Basic Rural Water Coverage by 2030 (figure above):

  • 16 countries on track, including: Morocco, Tajikistan, Lao PDR, Myanmar, Azerbaijan, Iraq, El Salvador, Kazakhstan, India, Vietnam, Tunisia, Brazil, Lithuania, Suriname, Panama. The most progress is being made by Morocco (+2.5%/year)
  • 61 countries are making progress, but too slowly.  The best progress is being made by Afghanistan and Mozambique (+2.1%/year)
  • 17 countries are going backwards, including: Iran, Fiji, Malaysia, North Korea, Serbia, Jamaica, Comoros, Gambia, Lesotho, Nicaragua, Guinea, Zimbabwe, Djibouti, Burkina Faso, Chad, Equatorial Guinea, Solomon Island. The biggest declines have been in Burkina Faso, Comoros and the Solomon Islands (-0.9%/year).

Which countries have the biggest rural water supply challenges?

The JMP data can examine this question in different ways – and a few new ones too. This is a quick-and-dirty dive into the data to look at which countries are struggling and should be given priority:

A column on water quality/contamination criteria is not included because the aggregated data for rural water is not available – and in many cases probably doesn’t exist.

These are just a few highlights, please take the time to read the report and explore the data portal.

Comprendre l’invisible: les efforts de l’Ouganda pour améliorer l’accès aux données détaillées sur les eaux souterraines

Il s’agit du second d’une série de quatre blogs intitulée ‘Le forage professionnel de puits d’eau: Apprendre de l’Ouganda” de Elisabeth Liddle et d’un webinaire en 2019 sur le forage de puits professionnel. Cette série s’appuie sur les recherches menées en Ouganda par Liddle et Fenner (2018). Nous vous invitons à nous faire part de vos commentaires en réponse à ce blog ci-dessous. [Note : Le blog original a été révisé le 3 avril 2019 pour corriger une représentation inexacte de la situation].

Si l’accès à des sources d’eau améliorées a augmenté de manière progressive dans l’ensemble de l’Afrique subsaharienne rurale, plusieurs études ont soulevé des problèmes concernant la capacité de ces sources à fournir des quantités d’eau sûres et adéquates à long terme (Foster et al., 2018 ; Kebede et al., 2017 ; Owor et al., 2017 ; Adank et al., 2014). La conception et l’emplacement des forages sont essentiels à ce que le point d’eau continue à fournir des quantités d’eau sûres et adéquates. L’accès à des informations détaillées et précises sur les eaux souterraines peut grandement faciliter le choix du site et la conception des forages (UNICEF/Skat, 2016 ; Carter et al., 2014).

La Fondation Skat et l’UNICEF ont été les principaux défenseurs d’un accès plus répandu à des données détaillées sur les eaux souterraines, y compris la récente note d’orientation qui souligne que “l’information sur les eaux souterraines” est essentielle à l’amélioration de la qualité de la mise en œuvre des forages dans les pays à revenus faible et intermédiaire (voir Figure 1 ; UNICEF/Skat, 2016). Dans ce blog, je donne un aperçu de la manière dont l’Ouganda a cherché à améliorer l’accès aux données sur les eaux souterraines ces dernières années.

Screen Shot 2019-04-01 at 4.58.03 PMScreen Shot 2019-04-01 at 4.57.43 PM

Fig. 1: Six domaines d’engagement pour l’exploitation professionnelle des eaux souterraines (Skat/ UNICEF, 2018)

La cartographie des ressources en eaux souterraines en Ouganda

Des mesures importantes ont été prises ces dernières années pour améliorer l’accès aux données détaillées sur les eaux souterraines en Ouganda. La plupart de ces activités ont débuté en 2000 lorsque la Direction de la gestion des ressources en eau du Ministère de l’eau et de l’environnement a lancé un projet de cartographie des eaux souterraines à l’échelle nationale. À l’aide de données tirées des rapports d’achèvement des forages que les entrepreneurs de forage doivent soumettre chaque trimestre, la Direction de la gestion des ressources en eau a élaboré une série de cartes pour chaque district. Il s’agit notamment des cartes suivantes :

  1. Carte de localisation des sources d’eau, avec carte géologique à l’appui.
  2. Carte des technologies recommandées par source d’eau (la recommandation de la technologie se base sur la profondeur de l’impact de l’aquifère principal et les données sur le rendement).
  3. Carte des conditions hydrogéologiques – elle comprend 4 sous-cartes : Profondeur présumée du premier impact avec l’eau[1],  la profondeur présumée de l’impact avec l’aquifère principal[2], l’épaisseur présumée des morts-terrains[3], etla profondeur statique présumée du niveau d’eau[4].
  4. Carte de la qualité des eaux souterraines : celle-ci met en évidence les zones où la qualité de l’eau pourrait poser problème.
  5. Potentiel des eaux souterraines – Carte du taux de réussite du forage : combine le taux de réussite prévu du rendement [5] et les conditions prévues de la qualité de l’eau.

Tindimugaya (2004) donne plus de détails sur ces cartes, ainsi que les façons dont elles peuvent faciliter le processus de mise en œuvre. Un exemple de cartes pour le district de Kibaale est disponible sur le site Web du Ministère de l’Eau et de l’Environnement.

Ce travail de cartographie est en cours, cependant, en mai 2017, la Direction de la gestion des ressources en eau avait cartographié 85% des districts de l’Ouganda. L’ampleur de ces cartes et le niveau de détail qu’elles contiennent sont remarquables. Ces cartes ont rendu service aux collectivités locales de district, aux organisations non gouvernementales et  autres responsables de l’implantation et de la construction des points d’eau.

Des défis persistents

Bien que l’Ouganda ait fait des progrès remarquables au cours des dernières années grâce à ses efforts de cartographie des eaux souterraines, plusieurs défis persistent (Liddle et Fenner, 2018), liés pour la plupart à l’exactitude des données. Lors d’entretiens avec les personnes interrogées en Ouganda dans le cadre de nos recherches, on nous a signalé que dans certains cas (mais pas tous), des données inexactes ont été fournies. Lorsqu’on examine les raisons pour lesquelles des données inexactes sont parfois fournies aux autorités, deux poins clés ont été relevés :

  1. Souvent, il n’y a pas de consultant qualifié sur place à temps plein pour la supervision du forage. Bien qu’il incombe à l’entrepreneur de forage de faire consigner le journal de forage par un membre du personnel, un superviseur indépendant devrait également tenir un journal et vérifier l’exactitude du journal du foreur avant de le soumettre à la Direction de la gestion des ressources en eau. Cependant, sans supervision à temps plein, cela n’est pas possible. De plus, même avec une supervision à temps plein, si le superviseur n’est pas un hydrogéologue, il est peu probable qu’il tiendra des registres précis et détaillés.
  2. Les conditions de paiement forfaitaires “pas d’eau, pas de paiement”, selon lesquelles les foreurs ougandais sont souvent payés (voir le blog “Contrats clés en main pour l’implantation et le forage des puits d’eau“). Ces modalités de paiement exigent des foreurs qu’ils prouvent qu’ils aient foré avec succès un point d’eau pour être payés; par conséquent, certains foreurs auraient exagéré le rendement d’un forage donné afin d’être payés. Les données faussées ainsi obtenues sont préoccupantes, car non seulement ces forages auront du mal à fournir des quantités adéquates d’eau après construction, mais les données liées à leur haut rendement sont ensuite saisies dans la base de données des journaux de forage et utilisées pour produire les cartes hydrogéologiques. Il est essentiel d’améliorer la qualité de la supervision des forages et de veiller à ce que les données ne soient pas faussées de cette façon si l’on veut que les cartes de la Direction de la gestion des ressources en eau soient plus précises à l’avenir.

Dans l’ensemble, l’Ouganda a fait des progrès remarquables au cours des deux dernières décennies en augmentant le niveau d’information sur les eaux souterraines disponible dans le pays. Il y a très peu d’exemples sur le continent africain comparables à ce que l’Ouganda a accompli ! Comme indiqué plus haut, les cartes qui en résultent représentent un grand avantage pour les autorités locales de district, les organisations non gouvernementales et les autres responsables de l’implantation et de la construction des points d’eau.

Il est essentiel pour l’Ouganda d’améliorer la précision des rapports d’achèvement des forages. En outre, d’autres pays pourront prendre conscience de ces défis lorsqu’ils entreprennent leurs propres exercices de cartographie et veiller à ce que les mesures nécessaires soient en place pour prévenir ces problèmes dans leur contexte.

Qu’en pensez-vous?

 Alors, qu’en pensez-vous? Avez-vous de l’expérience en matière de collecte ou gestion de données sur les eaux souterraines? Cela devrait-il être entrepris dans votre pays? Vous pouvez répondre ci-dessous en postant un commentaire, ou vous pouvez participer au webinaire en direct le 14 mai (inscriptions ici)

[1] Profondeur présumée du premier impact avec l’eau : la profondeur à laquelle un foreur est susceptible de rencontrer des eaux souterraines pour la première fois. Dans la plupart des cas, le foreur devra poursuivre le forage au-delà de ce point pour que le trou de forage puisse fournir suffisamment d’eau aux utilisateurs.

[2] Profondeur présumée de l’impact avec l’aquifère principal : la profondeur à laquelle un foreur est susceptible de trouver l’aquifère principal qui sera en mesure de fournir des quantités suffisantes d’eau aux utilisateuCarte de la qualité des eaux souterraines : celle-ci met en évidence les zones où la qualité de l’eau pourrait poser problème.

[3] Les morts-terrains désignent les matériaux non consolidés qui recouvrent le substratum rocheux. La carte de l’épaisseur prévue des morts-terrains met en évidence la profondeur prévue des matériaux non consolidé dans l’ensemble de l’Ouganda.

[4] Profondeur statique présumée du niveau d’eau = la profondeur d’eau souterraine attendue sans perturbation de pompage.

[5]   Le ” taux de réussite du rendement ” fait référence à un forage capable de supporter un débit de pompage de 500 litres/heure. Si un forage peut maintenir ce taux de pompage, il est considéré comme une réussite en ce qui concerne le rendement.

Références

Adank, M., Kumasi, T.C., Chimbar, T.L., Atengdem, J., Agbemor, B.D., Dickinson, N., and Abbey, E. (2014). The state of handpump water services in Ghana: Findings from three districts, 37th WEDC International Conference, Hanoi, Vietnam, 2014, Available from https://wedc-knowledge.lboro.ac.uk/resources/conference/37/Adank-1976.pdf

Carter, R., Chilton, J., Danert, K. & Olschewski, A. (2014) Siting of Drilled Water Wells – A Guide for Project Managers. RWSN Publication 2014-11 , RWSN , St Gallen, Switzerland, Available from http://www.rural-water-supply.net/en/resources/details/187

Foster, T., Willetts, J., Lane, M. Thomson, P. Katuva, J., and Hope, R. (2018). Risk factors associated with rural water supply failure: A 30-year retrospective study of handpumps on the south coast of Kenya. Science of the Total Environment,, 626, 156-164, Available from https://www.sciencedirect.com/science/article/pii/S0048969717337324

Kebede, S., MacDonald, A.M., Bonsor, H.C, Dessie, N., Yehualaeshet, T., Wolde, G., Wilson, P., Whaley, L., and Lark, R.M. (2017). UPGro Hidden Crisis Research Consortium: unravelling past failures for future success in Rural Water Supply. Survey 1 Results, Country Report Ethiopia. Nottingham, UK: BGS (OR/17/024), Available from https://nora.nerc.ac.uk/id/eprint/516998/

Liddle, E.S. and Fenner, R.A. (2018). Review of handpump-borehole implementation in Uganda. Nottingham, UK: BGS (OR/18/002), Available from https://nora.nerc.ac.uk/id/eprint/520591/

Owor, M., MacDonald, A.M., Bonsor, H.C., Okullo, J., Katusiime, F., Alupo, G., Berochan, G., Tumusiime, C., Lapworth, D., Whaley, L., and Lark, R.M. (2017). UPGro Hidden Crisis Research Consortium. Survey 1 Country Report, Uganda. Nottingham, UK: BGS (OR/17/029), Available from https://nora.nerc.ac.uk/id/eprint/518403/

Tindimugaya, C. (2004). Groundwater mapping and its implications for rural water supply coverage in Uganda. 30th WEDC International Conference, Vientiane, Lao PDR, 2004. Available from https://wedc-knowledge.lboro.ac.uk/resources/conference/30/Tindimugaya.pdf

UNICEF/Skat (2016). Professional water well drilling: A UNICEF guidance note. St Gallen, Switzerland: Skat and UNICEF. Available from http://www.rural-water-supply.net/en/resources/details/775

Remerciements

Ce travail fait partie du projet Hidden Crisis du programme de recherche UPGro – cofinancé par le NERC, le DFID et l’ESRC.

Le travail de terrain entrepris pour ce rapport fait partie de la recherche doctorale des auteurs à l’Université de Cambridge, sous la supervision du Professeur Richard Fenner. Ce travail sur le terrain a été financé par le Ryoichi Sasakawa Young Leaders Fellowship Fund et UPGro : Hidden Crisis.

Merci à ceux d’entre vous de l’Université de Makerere et de WaterAid Ouganda qui m’ont apporté un soutien logistique, y compris sur le terrain, pendant que je menais les entretiens pour ce rapport (en particulier le Dr Michael Owor, Felece Katusiime et Joseph Okullo de l’Université Makerere et Gloria Berochan de WaterAid Uganda). Merci également à tous les répondants d’avoir été enthousiastes et disposés à participer à cette recherche.

Photo: “Carte des technologies recommandées par source d’eau souterraine dans la division Eau du bureau du district de Kayunga” (Source: Elisabeth Liddle).


RWSN at the UNC Water and Health Conference: Where Science Meets Policy

The Water and Health Conference: Where Science Meets Policy, organized by the Water Institute at the University of North Carolina (UNC), is one of the most important conferences for WaSH professionals. This year the conference has not only explored the interactions between drinking water supply, sanitation, hygiene, water resources and public health, but put also a strong emphasis on rural water supply in developing countries. Researchers, practitioners and policy-makers had the chance to present and lively debate

by Sandra Fuerst and Sean Furey (Skat Foundation)

The Water and Health Conference: Where Science Meets Policy, organized by the Water Institute at the University of North Carolina (UNC), is one of the most important conferences for WaSH professionals. This year the conference has not only explored the interactions between drinking water supply, sanitation, hygiene, water resources and public health, but put also a strong emphasis on rural water supply in developing countries. Researchers, practitioners and policy-makers had the chance to present and lively debate on following topics:

  • Measuring Progress Toward Sustainable Development Goal (SDG) Targets
  • Water Scarcity
  • Rural Water Supply
  • WaSH Equity and Inclusion
  • WaSH in Emergencies

At this year’s conference, the RWSN and its partners have convened two side events, providing water professionals an interactive space for engaging on cutting-edge topics of rural water supply. These sessions translated the “virtual RWSN DGroups into real life discussion groups” as Stef Smits (IRC), the chair of the first side event, phrased it. The participating water experts shared their experiences and developed exciting ideas with their peers for challenging rural water contexts.

Universal and Sustainable Rural Water Services: Different Perspectives, Common Goals

In the first side event, participants were invited to understand two major concepts to apply them later through group discussions in a case study of an WaSH implementation organisation, HYSAWA, Bangladesh, presented by their Managing Director, Md. Nural Osman.

Md. Nurul Osman (HYSAWA)

Sara Ahrari presented the NGO perspective of how organisations, like Simavi, use monitoring and data systems to promote Social Accountability and the holding duty-bearers to account when it comes to the Human Rights to Water and Sanitation. Miguel Vargas-Ramirez from the World Bank and Ellen Greggio from WaterAid presented then the development partner perspective on how data and monitoring can be used to raise the capacity of governments and service providers to deliver sustainable rural WaSH services, particularly rural water supply. This included on-going work to develop benchmarks for rural water service delivery, which WaterAid is testing in Myanmar.

After the break, Elisabeth Liddle from Cambridge University, and Prof. Rob Hope from Oxford University, gave the research perspective on how data and monitoring is enabling them to generate deeper insights into why rural water supply systems fail and how to develop new ways of making them more sustainable.

After the concepts have been introduced, the participants applied them in smaller groups to the HYSAWA case study in Bangladesh. This case study was presented by HYSAWA (Hygiene, Sanitation and Water Supply) to come up with suggestions and advice on how his organisation can improve the quality and sustainability of their rural WaSH interventions. The audience debated questions around:

  • Who is responsible for monitoring and data collection? Who is accountable and feels responsible for what? Those who design the system?
  • Who is responsible for the service provision of water in rural areas? And who needs to be hold accountable for that?
  • What are the drivers to feeling responsible?
  • What are the services that needs to be done?
  • How do the processes need to be managed?

Stef Smits (IRC)

Stef Smits summarised the debates during this session on three levels:

Who? The answer that communities and local governments should be accountable for the service provision of water in rural areas seemed to be too easy as in fact it is not clear at all. The role of service providers in many contexts is not very well defined, also not in legal terms. Accountability is often spread over several layers. For example, minor operation and maintenance (O&M) services can be done on community level, while major O&M services can be provided through public services. Then the levels of accountability also need to be differentiated between service provider and service authority. This first differentiation will help to define who is responsible for what and will help the service authority to hold the service provider accountable. As soon as the roles of different stakeholders are clearly defined, it can be defined more specifically who needs to collect the data. The collection of data then needs to be spread over different levels, from household, community, service provider to authority level.

What? The debate started around the functionality of rural water supply devices and has shown that there is not a simple answer of ‘yes’ or ‘no’ to functionality. Functionality needs to be distinguished between functional devices and functional services (i.e. O&M services). This led to the question how functionality should be measured and which other indicators should be taken into account. Should we bring water quality in as an indicator? Clearly, financial indicators are necessary. As the trend to use indicators and monitoring tools is increasing among service providers and governments in rural areas, it becomes increasingly necessary to define clear indicators for universal rural water services. Based on that development, we can start to understand rural water as a systemic issue.

How? The identified need to define clear indicators on different levels, raised the question of how the process of developing monitoring and evaluation (M&E) systems should be managed. Even though governments were identified to lead this process, NGOs could support to trigger it. However, if a NGO has developed a working M&E systems, it cannot be simply handed over from a NGO to the government, without a well-planned transition phase. It also needs to be taken into account who “the government” is and on which level the government operates. Data and M&E systems will at the end always need a sector development approach.

Pipe Dream or Possible: Reaching the Furthest Behind First in the WASH Sector? – RWSN Side Event 2

The second side event was convened by RWSN (Simavi, Wateraid) with London School of Hygiene & Tropical Medicine and World Vision. During this session, the participants developed human-centred solutions for “Reaching the Furthest Behind First” and “Leaving No One Behind” in the WASH sector.

I7.jpg

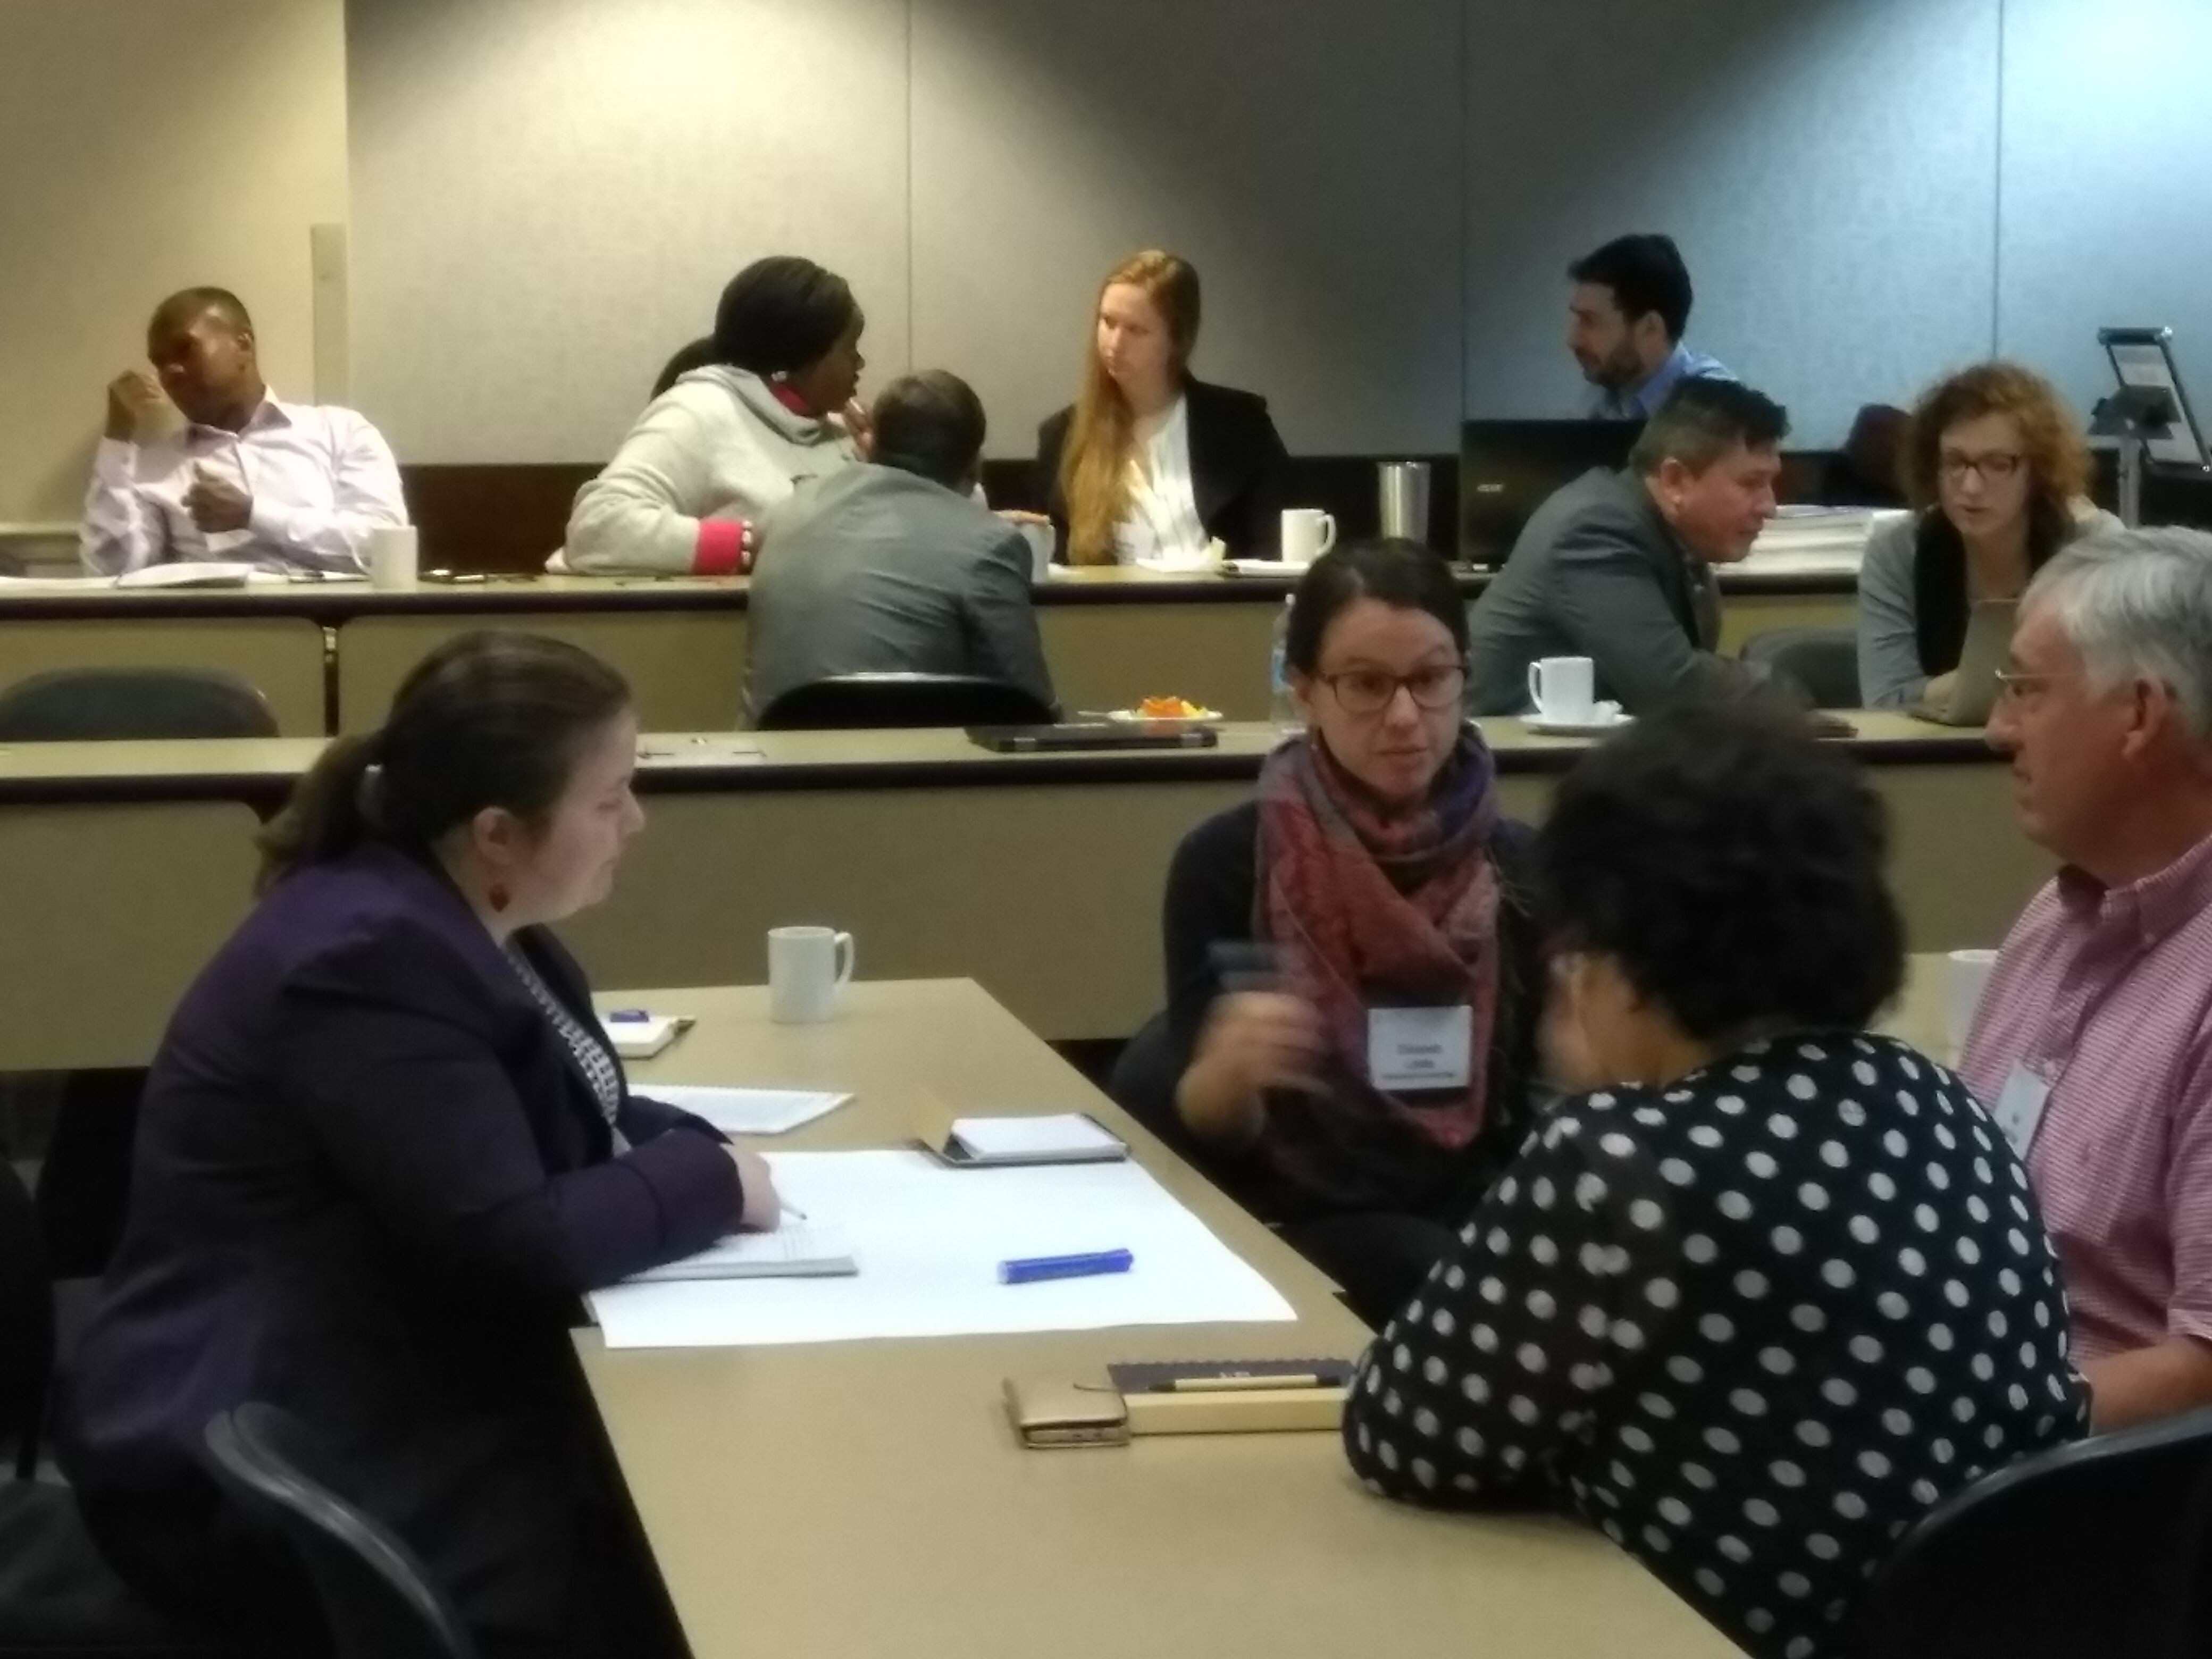
The participants worked in several groups on different case studies of extremely vulnerable people (i.e. disabled pregnant child) that are exposed to extreme hazards in their environment (i.e. arsenic contamination of groundwater).

In several steps, the participants developed possible solutions based on their field of expertise: In a first step, they illustrated the social, cultural, physical, political and legal barriers that the imaginary persona faced, regarding their social inclusion. Then they created inspirational ideas of possible solutions to these barriers. The different options were heavily discussed before choosing one or more solutions. To illustrate the actions and stakeholders needed to implement these solutions, a story board was created by each group. Finally, the persona, storyboard and possible solution were presented in pitches to all participants.

IMG_20181101_111922-v2


The two side events have been great examples of how the RWSN works as its best: “Taking concrete examples and bring them together with key concepts from research and practice. This is the richness that RWSN provides: Linking practical questions with conceptional frameworks (Stef Smits)”.

Sharing experiences of data flows in water and sanitation – some reflections from AGUASAN Workshop 2018

A perspective on the 2018 AGUASAN Workshop: “Leveraging the data revolution Informed decision-making for better water and sanitation management” June 25th to 29th 2018, Spiez, Switzerland

AGUASAN Workshop: “Leveraging the data revolution Informed decision-making for better water and sanitation management” June 25th to 29th 2018, Spiez, Switzerland 

Update 24/08/2018: Read the AGUASAN event report

AGUASAN is the Swiss Community of Practice for water and sanitation that has been running since 1984 and comprises regular meetings through the year and an annual week-long workshop focused on a specific topic, which this year was around role of data in decision-making in water and sanitation services. Around 40 participants attended at a really great training facility in Spiez, in central Switzerland. They came, not just from Swiss organisations, but from a wide range of partners (many who are active RWSN members). There were participants from Bangladesh, Tajikistan, Mozambique, Peru, Thailand, Mali, Pakistan, Benin, Egypt, Mongolia, the UK, South Africa, US and many more.

The structure of the event mixed up presentations with “Clinical Cases” group work focused on real-world case studies and challenges where participants could advise representatives from those organisations:

Different aspects issues around data use in water and sanitation were introduced through a good range of engaging presentations:

AGUASAN workshops aim to come out with useful output and what was proposed was a practical guideline that pulled together they key points from the presentations and discussions, around a common framework, which was beautifully illustrated on the wall of the plenary room at the end:


aguasan.jpg
Preliminary result of the AGUASAN workshop: the “Navigator manual” (click/tap to expand) designed by Filippo Buzzini (Sketchy Solutions)


I was not completely convinced by the linear conceptual framework that was proposed because what I have observed previously, and came out in the discussion and presentations, is that WASH systems are generally messy, non-linear processes. However, what was clear is that good quality monitoring, mapping and data is a critical “fuel” for driving positive feedback loops for short-term operational decision-making and longer term learning and adaptation cycles.

aguasan.jpg
A not-so-pretty graphical summary by your correspondent (click/tap to expand).

Despite Skat’s long association with the AGUASAN workshop this was my first workshop and I enjoyed it, and found it useful to have the opportunity to have a few days away from the distractions of emails, to focus on one topic with knowledgeable colleagues from all over the world and all over the WASH sector. The field trips also took us to explore some of Switzerland fascinating water history and modern challenges.

29323801718_3e5594b0cc_z.jpg
Your correspondent giving a lighthearted recap of key learning points (and Swiss World Cup win against Serbia) from Day 1 (Photo. J. HeeB)

Tandi Erlmann, Johannes Heeb and the Cewas team did a great job with the facilitation and event design and also thanks to SDC for their continued financial and thematic support to the event. As well as good for networking – it was also a good international crowd to be around with the World Cup going on!

The final report will be published on www.aguasan.ch where you can find outputs from previous workshops. Most of the presentations and background documents can be on the SDC ResEau website.  Photos from the event can be found here on Flickr.

Below are my sketch-notes of some of the presentations (click/tap to enlarge):

“Monitoring & Data for Rural Water Supplies” (click/tap to open PDF version)


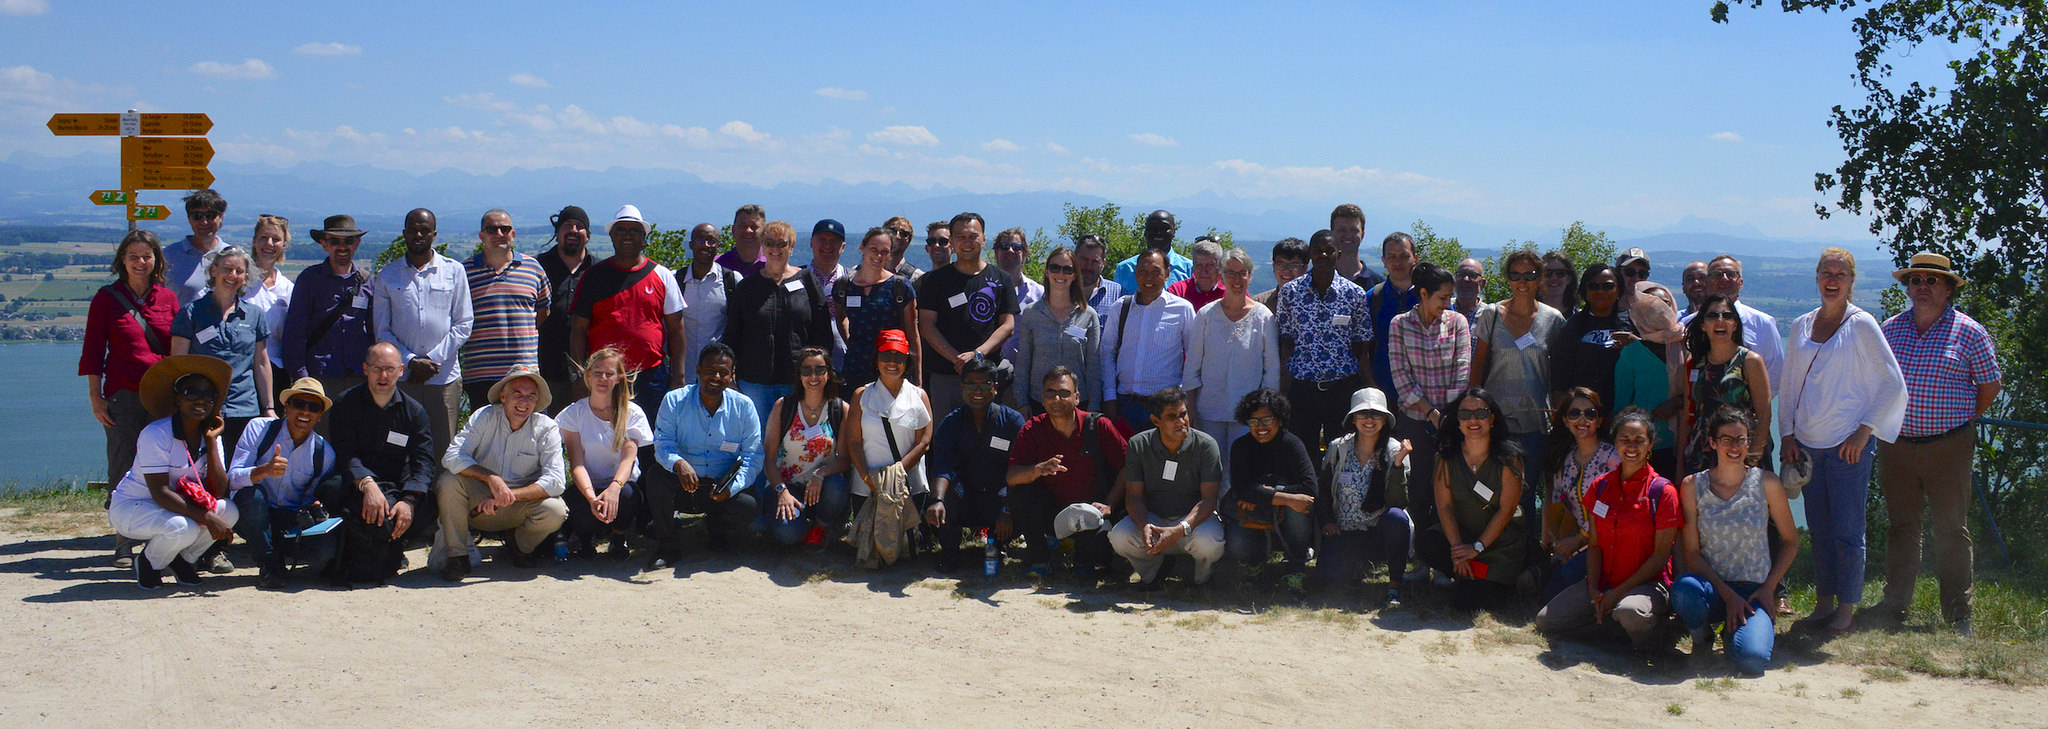
Photos: Johannes Heeb (Cewas) – Main Image: group shot of workshop participants

You cannot manage what you do not measure; but should you measure what you cannot manage?

Countries have committed to reach SDG 6, providing universal access to their population with safely managed water supply services, with country specific targets. This is a process that governments, as duty bearers, need to manage. Therefore they also need to measure progress in that.
Continue reading “You cannot manage what you do not measure; but should you measure what you cannot manage?”

New 2018 RWSN webinar series (April 3rd – June 5th, 2018)

Mark your calendars! RWSN is delighted to announce its 2018 series of 10 webinars dedicated to rural water services, April 3 -June 5, in English, French, Spanish and/or Portuguese!

To attend any of the webinars, please register here by April 2nd: http://bit.ly/2prrVf3

We will hear from more than 20 organisations on a range of topics, including:

· A special double session with the WHO/ UNICEF Joint Monitoring Programme to find out how you can make the most of the JMP data, and how countries nationalise SDG6 targets and indicators (May 2nd and May 29th);

· The challenges specific to sustainable and safe water supply in peri-urban areas and small towns, with a focus on the urban poor (April 17th and 24th);

· Practical ways of financing to reduce corruption in the sector (April 3rd), and to improve social accountability for better rural water services (May 8th);

· A discussion on community-based water point management (April 10th), and a radio show-style session showcasing experiences with capacity strengthening for professional drilling (June 5th);

· A debate on water kiosks (May 15th), and the role of self-supply and local operator models for universal access in rural areas (May 22nd).

To find out more about the session topics, dates and times, see here: http://www.rural-water-supply.net/en/news/details/66

To attend any of the webinars, please register here by April 2nd: http://bit.ly/2prrVf3

Why is Groundwater Data important?

by Dr Fabio Fussi, Università degli Studi di Milano-Bicocca

The role of groundwater data in rural water supply has changed markedly in over the last few year:

6th RWSN Forum in Kampala, 2011: Some pilot projects of groundwater data collection and organization is presented. Uganda is presenting its groundwater atlas, a promising example for other countries.

7th RWSN Forum in Abidjan,  2016: there were entire sessions dedicated to groundwater data collection, mapping, analysis and application, with presentation of country programs from national water institutions, some example of international projects to create continental or world groundwater database (e.g. the groundwater atlas of Africa from the British Geological Survey) and application of groundwater data analysis.

What has raised the interest up to this level? There are several factors:

  • Data collection has become easy, with IT tools available in portable devices and smartphones for water point mapping. The increased availability of information has allowed to use these data to take decision about groundwater development and monitoring.
  • Depletion of groundwater resources (both in quantity and quality) requires the definition of sustainable groundwater development strategies and monitoring the effectiveness and impact of their implementation.
  • International donors have an increased interest to support countries to create groundwater information system, and national water institutions have, in several cases, understood the importance to put effort in this.

This seems a promising path for the future to support an effective and sustainable use of groundwater. However there are critical factors that must be taken into consideration:

  1. An increasing amount of data are available, but still there is lack of control in their quality. National databases are full of information, but limited effort is spent to revise them and depurate from mistakes. If this aspect is not properly considered, the risk of incorrect interpretation is high, leading to the formulation of incorrect strategies.
  2. Despite of the huge amount of information and the availability of powerful tools to process it, the level of data analysis to deepen our understating of groundwater system and give a practical support for complex decisions seems still basic. At this time we need creativity, technical capacity and collaboration between decision makers and scientist to unlock the potential of massive groundwater databases.
  3. An unbelievable amount of information is available, held by national water authorities and organizations involved in groundwater development. Most of this information is in hard copy, almost unused, not yet transformed into numeric database. This task is huge and time consuming, but if we can support it, we avoid the risk to loose relevant data and in they can be easily used to take decisions.

In the coming years the effect of climate change and the increase in water needs (due to population growth and improved living conditions) will lead to a more intense exploitation of groundwater resources, whose feasibility and sustainability must be carefully evaluated by a detailed interpretation of reliable data.

WPDx webinar: Beyond Water Point Mapping: Putting Data to Work for Improved Services

Too often, valuable data sits dormant in PDF reports and excel spreadsheets, never being used to its full potential to improve services.

Join this webinar and learn from people trying to change that. Joining Global Water Challenge will be Applied Predictive Technologies (APT) sharing findings from their Data Dive of the Water Point Data Exchange (WPDx) dataset and WASHNote addressing their recently-authored white paper: “Harnessing Water Point Data to Improve Drinking Water Services.” Akvo will moderate the session, lending their extensive water point data expertise.

By the end of the webinar, you will learn strategies to put your data to work for improved water services.

Register here

Gender and rural water services – lessons from RWSN members

Gender relations are critical to nearly every aspect of rural water supply, but rarely addressed in practice by rural water professionals. All water supply programmes affect men and women in different ways, and while practitioners assume their work will benefit women, how do they know whether it will or not, how do they know what impact it will have?

In 2016 RWSN’s Mapping and Monitoring Theme members had an impromptu and rich e-discussion on gender equality and WASH. In early 2017, RWSN’s Equality, Non Discrimination and Inclusion (ENDI) Theme launched a call to their members for examples of inspiring experiences of ‘Making Water Work for Women’. Both discussions have been rich with experiences from across Asia, Africa and Latin America, and reinforcing of each other. We have put together a short brief highlighting the key points from these discussions:

  • The nature of female participation within water committees should be discussed in terms of quality as well as quantity.  If women’s roles do not offer any opportunity to influence committee decisions and outcomes, their participation is largely tokenistic. Qualitative indicators can help to show whether women’s participation is tokenistic, or active and meaningful.
  • High-level government commitment to minimum quotas for women’s participation was seen as a crucial prerequisite to creating the space for the inclusion of women and the ability to demand it.
  • Where women were more influential on Water User Committees, it was strongly attributed to the special efforts of implementing organisations who worked on mobilising women and increasing their confidence and awareness about  the work involved, and sensitising men equally to create space for women’s involvement in the committees, as the example in India shows.
  • By working closely with women and men together it is possible to challenge gender norms amongst women and men in rural communities, so that they begin to share unpaid work associated with WASH more equally, as the example in Ethiopia shows.
  • Identifying the agents of change (women and men) from the community who are motivated and determined to advocate for water and sanitation can nurture lifelong advocates, as illustrated by the experience from Bangladesh.
  • Disaggregating monitoring indices by gender can help to raise gender equality as a priority, and set specific expectations about the participation of women in different aspects of service provision.
  • Conflict-sensitive approaches to water and sanitation can help to facilitate peace building by creating a platform for women around a common need, as in the example from India.

Download the brief : Gender and rural water services – lessons and experience from RWSN members