From Colombia to Kyrgyz Republic and Uganda: how we help countries adopt state-of-the art information systems for better management of rural water services

How many countries have you worked in where an up-to-date national information system for rural water services is used for decision-making?

SUSANNA SMETS (World Bank/RWSN Sustainable Services) & ANTONIO RODRÍGUEZ SERRANO (World Bank/RWSN Mapping & Monitoring (re-blogged from the World Bank)

How many countries have you worked in where an up-to-date national information system for rural water services is used for decision-making?

How many well-intended monitoring initiatives did you encounter which are no longer being used?

Your answers are likely to be “few” and “many”, as government-led information systems to support planning and decision making for fragmented rural water services are not easy to develop, institutionalize, and sustain.

It is widely recognized that information systems are a key building block to achieve sustainable rural services delivery – a top development priority given that 8 out 10 people without basic water services live in rural areas, leaving 628 million people unserved. The good news is that a customizable, tried and tested solution already exists, so that countries can leap-frog a cumbersome development process and – more importantly – go through a fast learning curve when adopting and institutionalizing the Rural Water and Sanitation information System or “SIASAR” as their national rural sector monitoring and evaluation (M&E) system.

Following the initiative of the governments of Honduras, Nicaragua, and Panama, 11 countries in Latin America and the Caribbean are using the innovative open-data platform “SIASAR”. Different actors are using this tool for decision making, strategic planning, rural water performance monitoring, and for taking appropriate actions to prevent services from deteriorating, ensuring that water keeps flowing from the taps and communities receive timely support. SIASAR has been supported by the World Bank since its inception in 2010. In particular, Global Water Security and Sanitation Partnership (GWSP), a multi-donor trust fund housed within the World Bank’s Water Global Practice, provides funding to SIASAR.

Following the initiative of the governments of Honduras, Nicaragua, and Panama, 11 countries in Latin America and the Caribbean are using the innovative open-data platform “SIASAR”.

With its adaptability and multi-language capability, SIASAR has now been introduced in the Kyrgyz Republic (in Russian and Kyrgyz languages), and a pilot has also been planned in Uganda. Within the context of the Kyrgyz Republic’s national rural water program, supported by the World Bank-supported Sustainable Rural Water Supply and Sanitation Project, SIASAR has now gradually been introduced as the sector’s M&E system, covering data on system status and service provider performance for almost a third of its 1800 remote and mountainous villages. This will help to target investments and achieve the Kyrgyz Government’s vision to reach universal access by 2026.

With support from GWSP and the World Bank’s office in Colombia, the South-South Knowledge Exchange Facility helped bring Kyrgyz and Ugandan delegations together in Colombia. This knowledge exchange allowed them to receive peer-to-peer advice on how to introduce, roll out, and use SIASAR, and to learn about effective policy instruments, regulations, and institutional arrangements for sustainable rural water supply and sanitation service provision.

With support from GWSP and the World Bank’s office in Columbia, the South-South Knowledge Exchange Facility helped bring Kyrgyz and Ugandan delegations together in Colombia.

Specifically, the delegations learned about Colombia’s differentiated policy and regulatory instruments for rural areas, including tariff policies, water quality and environmental regulations, technical standards for water supply and sanitation, financing modalities for investments, and of course the SIASAR information systems for evidence-based decision making. Through field visits, the responsibilities of local and regional governments in rural service delivery in Colombia were better understood. The three-way translation between Spanish, English, and Russian put in place and the excellent collaborative spirit by all parties helped to overcome the communication challenge. These delegates took away important lessons on the adaptation process for SIASAR, such as:

  • SIASAR implementation and scale-up requires dedicated human and financial resources at the national and regional levels, including both sectoral and IT experts.
  • A clear roadmap for SIASAR adoption is necessary, bringing in multiple partners to support implementation. Anchoring in national legislation and fostering linkages with other national statistical information systems is critical.
  • SIASAR can cater analysis to the need of different actors and increases transparency and accountability of service provision.
  • SIASAR has helped to inform and influence investment programs to close the urban-rural service gap, accompanied by a range of measures to support rural service providers.

Depending on where they were in the adoption of SIASAR, the Kyrgyz delegation was keen to grasp the process of institutionalization, while the Ugandans were exposed to the range of capabilities and practical first steps that have now led to a first pilot, supported by the Uganda Integrated Water Management and Development Project (IWMDP).  

Seeing solutions in action can be a great motivation. The knowledge exchange with Colombiastimulated learning and encouraged officials from Kyrgyz and Uganda to try and adopt solutions to their own circumstances. A guide is now available that can help any country go through the process and prepare for the steps of adopting SIASAR.

SIASAR has proven to be an effective tool for improving the monitoring, evaluation, planning, and coordination of water supply and sanitation services in participating countries in Latin America and beyond. Through knowledge exchange activities like this and future GWSP technical assistance, we hope to support more countries in adopting the system and joining the initiative, while we commit to continuous improvement of the capabilities of the system. 

Just how much do countries rely on groundwater point sources for their drinking water?

Preliminary analysis of census and national survey data from the 2019 Joint Monitoring Programme, by Dr Kerstin Danert

An important issue for those of us that think a lot about groundwater is the extent that various countries rely on it for their drinking water.

The data presented in the table below has been prepared from the 2019 data published by the Joint Monitoring Programme (JMP) of the World Health Organisation (WHO) and UNICEF (see https://washdata.org/data). Each country has an associated Country File (an excel spreadsheet) with collated data on Water, Sanitation and Hygiene use. This data is gathered from national censuses as well as household surveys such as the Demographic and Health Surveys (DHS) and Multiple Indicator Cluster Surveys (MICS) and many others. The country files given excel spreadsheets on the JMP website (not to mention the underlying surveys) contain a wealth of data!

The table below shows the percentage of the population that rely on groundwater point sources as their main source of drinking water for every country and territory for the most recent year for which census or survey data is available. The data is presented for urban, rural and total populations.  Groundwater point sources include protected and unprotected wells and springs, as well as tube wells and boreholes.  Countries may have slightly different nomenclature for the above terms, but these are harmonised in the country tables produced by the JMP.

It is important to note that the data only includes point sources.  Water that is bought from vendors, sold in bottles/sachets or transmitted in pipes may also originate from groundwater, but this information is not generally collated by the censuses or surveys and thus cannot be reflected.  Consequently, the actual dependency of a particular on groundwater for drinking may be considerably higher. In addition, national governments may also make calculations based on the infrastructure available and assumed number of users per source. Due to the different methods of data collection and calculation, these estimates may differ from that collected by the household survey or census.

Please note that the analysis below has not been peer-reviewed, and so if you are intending to use the data, please do check in the respective JMP country file.  You can access Country Files on: https://washdata.org/data. Click on map to select country, download “Country file” and open the “Water Data” tab. In case you spot any mistakes in the table below, please respond in the comments in the blog below or contact the author directly, via rwsn@skat.ch.

Table 1 Groundwater point source as main drinking water source (% of the population classified as urban, rural and total)

Urban Rural Total
Country Census/ Survey Year Ground-water point source as main drinking water source (% of the urban pop.) Census/ Survey Year Ground-water point source as main drinking water source (% of the rural pop.) Census/ Survey Year Ground-water point source as main drinking water source (% of the total pop.)
Afghanistan 2017 57.3% 2017 71.5% 2017 68.1%
Albania 2012 6.4% 2012 14.7% 2012 10.2%
Algeria 2013 6.6% 2013 19.6% 2013 11.3%
American Samoa 2010 0.5%
Andorra 2005 6.6%
Angola 2016 17.7% 2016 43.0% 2016 26.8%
Anguilla 2009 0.7% 2009 0.7%
Antigua and Barbuda 2011 0.4%
Argentina 2013 9.1% 2010 37.7% 2010 15.0%
Armenia 2016 0.1% 2016 2.6% 2016 1.1%
Aruba 2010 1.3%
Australia 2013 0.1% 2013 1.1% 2013 0.5%
Azerbaijan 2017 0.1% 2017 12.1% 2017 5.4%
Bahamas 2010 2.9%
Bahrain 1995 1.4%
Bangladesh 2016 66.4% 2016 94.7% 2016 84.9%
Barbados 2010 0.1% 2012 0.1%
Belarus 2012 2.7% 2012 32.9% 2012 11.1%
Belize 2016 0.3% 2016 4.1% 2016 2.5%
Benin 2014 39.4% 2014 56.8% 2014 48.9%
Bhutan 2017 0.3% 2017 0.6% 2017 0.5%
Bolivia (Plurinational State of) 2017 5.0% 2017 42.2% 2017 16.5%
Bosnia and Herzegovina 2012 3.6% 2012 11.4% 2012 8.9%
Botswana 2017 0.1% 2017 14.9% 2017 5.3%
Brazil 2017 0.4% 2017 8.4% 2017 1.6%
British Virgin Islands 2010 1.9%
Brunei Darussalam 2011 0.1% 2011 0.1% 2011 0.1%
Bulgaria 2001 0.4% 2001 2.7% 2001 1.1%
Burkina Faso 2017 17.1% 2017 85.6% 2017 72.9%
Burundi 2017 8.6% 2017 68.1% 2017 61.5%
Cabo Verde 2007 0.1% 2012 15.1% 2012 5.1%
Cambodia 2016 13.5% 2016 47.2% 2016 40.2%
Cameroon 2014 35.5% 2014 74.1% 2017 50.0%
Canada 2011 0.1% 2011 0.7% 2011 0.3%
Caribbean Netherlands 2001 27.3%
Cayman Islands 2010 4.9% 0.0% 2010 4.9%
Central African Republic 2010 49.1% 2010 92.1% 2010 75.4%
Chad 2015 48.0% 2015 82.4% 2015 74.6%
Chile 2017 0.6% 2017 4.0% 2017 2.4%
China 2013 7.4% 2013 43.1% 2016 22.4%
Colombia 2018 0.4% 2018 13.7% 2018 3.3%
Comoros 2012 5.1% 2012 21.3% 2012 16.2%
Congo 2015 24.9% 2015 65.7% 2015 38.3%
Cook Islands 2011 0.0%
Costa Rica 2018 0.0% 2018 0.5% 2018 0.2%
Côte d’Ivoire 2017 33.9% 2017 71.0% 2017 49.5%
Croatia 2003 3.3% 2003 18.0% 2003 20.0%
Cuba 2011 13.5% 2014 41.9% 2011 18.2%
Curaçao 2011 0.9%
Czechia 2003 1.5% 2003 7.1%
Democratic People’s Republic of Korea 2017 17.1% 2017 58.1% 2017 33.1%
Democratic Republic of the Congo 2014 33.0% 2014 79.4% 2014 63.5%
Djibouti 2017 0.6% 2017 55.5% 2017 10.9%
Dominica 2001 0.6% 2001 6.3% 2009 0.3%
Dominican Republic 2016 0.1% 2016 2.3% 2016 0.7%
Ecuador 2017 1.1% 2017 17.1% 2017 6.1%
Egypt 2017 0.4% 2017 2.1% 2017 1.4%
El Salvador 2017 3.0% 2017 12.3% 2017 6.6%
Equatorial Guinea 2011 44.7% 2011 51.9% 2011 48.4%
Eritrea 2010 3.4% 2010 36.0% 2010 24.6%
Estonia 2010 1.7% 2010 18.8% 2010 6.7%
Eswatini 2014 3.7% 2014 31.5% 2014 24.0%
Ethiopia 2017 5.1% 2017 62.3% 2017 52.0%
Falkland Islands (Malvinas) 2016 43.7%
Fiji 2014 1.1% 2014 13.6% 2014 7.2%
Finland 1999 1.0% 2005 5.0% 2005 1.0%
French Guiana 1999 5.0% 1999 6.0% 2015 13.5%
Gabon 2013 3.3% 2013 37.8% 2013 8.2%
Gambia 2013 14.4% 2013 60.0% 2013 32.6%
Georgia 2017 4.9% 2017 46.9% 2017 22.2%
Germany 2007 0.8% 2007 0.8% 2007 0.0%
Ghana 2017 11.3% 2017 56.7% 2017 36.0%
Greece 2001 0.2% 2001 3.8%
Grenada 1999 4.0% 1999 18.0%
Guadeloupe 2006 0.8% 2006 0.3% 2006 0.8%
Guam 2010 0.1%
Guatemala 2015 5.0% 2015 19.6% 2015 13.4%
Guinea 2016 32.8% 2016 75.3% 2016 59.0%
Guinea-Bissau 2014 41.0% 2014 78.0% 2014 61.7%
Guyana 2014 1.3% 2014 5.5% 2014 4.4%
Haiti 2017 8.1% 2017 56.5% 2017 37.5%
Honduras 2017 2.0% 2017 4.2% 2017 3.0%
Hungary 1990 5.0% 1990 28.9%
India 2016 23.8% 2016 63.7% 2016 50.5%
Indonesia 2018 35.2% 2018 66.9% 2018 49.6%
Iran (Islamic Republic of) 2015 1.8% 2015 4.6% 2015 0.8%
Iraq 2018 0.5% 2018 4.6% 2018 1.8%
Ireland 2006 0.0% 2006 0.5%
Italy 2001 3.9%
Jamaica 2014 0.0% 2014 1.2% 2014 0.6%
Jordan 2016 0.3% 2016 0.7% 2016 0.4%
Kazakhstan 2015 3.2% 2015 21.0% 2015 11.5%
Kenya 2017 21.2% 2017 54.1% 2017 46.2%
Kiribati 2014 0.0% 2014 0.0% 2014 0.0%
Kyrgyzstan 2014 1.1% 2014 11.3% 2014 8.1%
Lao People’s Democratic Republic 2017 9.0% 2017 46.0% 2017 34.7%
Latvia 2003 2.4% 2003 12.5%
Lebanon 2016 10.9%
Lesotho 2015 5.5% 2015 27.8% 2015 21.4%
Liberia 2016 58.7% 2016 74.7% 2016 65.3%
Libya 1995 35.8% 1995 26.9% 2014 19.1%
Madagascar 2016 24.5% 2016 61.6% 2016 57.6%
Malawi 2017 16.3% 2017 86.0% 2017 73.8%
Malaysia 2003 0.8% 2003 6.7%
Maldives 2014 0.1% 2014 0.2% 2017 0.5%
Mali 2018 19.5% 2018 72.3% 2018 56.2%
Marshall Islands 2017 0.2% 2017 2.5% 2017 0.6%
Martinique 1999 0.5% 2015 0.4%
Mauritania 2015 6.5% 2015 49.4% 2015 29.1%
Mayotte 0.0% 2013 2.5%
Mexico 2017 0.8% 2017 9.5% 2017 2.8%
Micronesia (Federated States of) 2010 3.6% 2010 10.7% 2010 9.1%
Mongolia 2016 12.8% 2016 52.7% 2016 25.8%
Montenegro 2013 5.1% 2013 29.2% 2013 14.1%
Montserrat 1998 2.0% 1998 100.0% 2001 0.1%
Morocco 2012 1.0% 2012 27.2% 2012 10.2%
Mozambique 2015 21.4% 2015 62.5% 2015 49.6%
Myanmar 2016 34.3% 2016 74.8% 2016 64.0%
Namibia 2016 0.6% 2016 23.4% 2016 11.8%
Nauru 2011 1.6% 2011 0.0% 2011 1.6%
Nepal 2016 41.8% 2016 46.8% 2016 44.4%
New Caledonia 2014 3.1%
Nicaragua 2014 4.4% 2014 59.9% 2016 21.4%
Niger 2017 33.9% 2017 71.0% 2017 49.5%
Nigeria 2018 45.3% 2018 73.1% 2018 60.0%
Niue 1999 20.0% 2010 0.0%
North Macedonia 2011 1.5% 2011 15.1% 2011 7.7%
Northern Mariana Islands 2000 1.3% 0.0% 2010 1.1%
Oman 2014 5.1% 2014 10.0% 2014 6.4%
Pakistan 2016 30.4% 2016 44.0% 2016 39.1%
Panama 2015 0.7% 2015 14.6% 2017 0.0%
Papua New Guinea 2017 2.8% 2017 7.5% 2017 7.1%
Paraguay 2017 2.1% 2017 9.2% 2017 4.8%
Peru 2017 1.5% 2017 11.1% 2017 3.8%
Philippines 2017 8.4% 2017 37.6% 2017 23.9%
Portugal 2001 0.1% 2001 0.7%
Puerto Rico 1995 1.8%
Republic of Korea 2015 1.0%
Republic of Moldova 2012 16.9% 2012 65.1% 2012 47.1%
Réunion 2015 0.2%
Romania 1994 11.3% 1994 81.0%
Russian Federation 2009 3.4% 2009 19.5% 2009 8.6%
Rwanda 2017 17.2% 2017 58.4% 2017 50.4%
Saint Kitts and Nevis 1999 27.0% 1999 27.0% 2007 0.3%
Saint Lucia 2012 0.5% 2012 2.0% 2012 1.6%
Saint Vincent and the Grenadines 1999 20.0% 2012 0.1%
Samoa 2016 2.6% 2016 5.6% 2016 5.0%
Sao Tome and Principe 2010 4.5% 2010 11.7% 2010 6.9%
Saudi Arabia 2017 0.2%
Senegal 2017 7.2% 2017 35.0% 2017 22.5%
Serbia 2014 2.4% 2014 11.7% 2014 6.2%
Sierra Leone 2017 54.7% 2017 68.9% 2017 62.6%
Sint Maarten (Dutch part) 2011 7.4%
Slovakia 2003 2.3% 2003 2.3% 2011 13.1%
Solomon Islands 2015 8.6% 2016 27.6% 2015 17.5%
Somalia 2017 9.5% 2017 60.5% 2017 34.1%
South Africa 2017 0.5% 2017 10.1% 2017 3.8%
South Sudan 2017 66.5% 2017 80.1% 2017 77.3%
Spain 2003 0.6% 2003 0.3%
Sri Lanka 2016 17.3% 2016 51.0% 2016 45.3%
Sudan 2014 2.2% 2014 13.2% 2014 9.8%
Suriname 2017 3.1% 2017 5.4% 2017 3.8%
Syrian Arab Republic 2018 4.2% 2018 11.6% 2018 8.4%
Tajikistan 2017 5.2% 2017 18.7% 2017 15.4%
Thailand 2016 1.8% 2016 6.2% 2016 4.2%
Timor-Leste 2016 20.0% 2016 33.6% 2016 29.9%
Togo 2017 36.6% 2017 61.2% 2017 51.8%
Tonga 1999 28.0% 1999 24.0% 1996 1.7%
Trinidad and Tobago 2011 0.9% 2011 1.0% 2011 0.9%
Tunisia 2015 0.5% 2015 10.8% 2015 3.7%
Turkey 2013 5.0% 2013 40.0% 2013 13.0%
Turkmenistan 2016 4.4% 2016 34.3% 2016 22.6%
Turks and Caicos Islands 1999 22.0% 1999 40.0% 2012 1.7%
Tuvalu 2007 1.7% 2007 0.5% 2007 1.1%
Uganda 2017 35.8% 2017 79.6% 2017 71.9%
Ukraine 2018 11.5% 2018 61.2% 2018 27.8%
United Arab Emirates 2003 0.2% 2018 0.1%
United Republic of Tanzania 2017 19.4% 2017 50.5% 2017 41.2%
United States of America 2015 3.0% 2015 45.2% 2015 11.1%
Uruguay 2017 0.0% 2017 3.1% 2017 0.2%
Uzbekistan 2015 6.9% 2015 22.7% 2015 14.2%
Vanuatu 2016 1.6% 2016 4.8% 2016 4.0%
Venezuela (Bolivarian Republic of) 2011 4.3% 2011 25.6% 2011 6.8%
Viet Nam 2016 19.5% 2016 57.2% 2016 45.2%
West Bank and Gaza Strip 2017 1.2% 2017 3.2% 2017 1.5%
Yemen 2013 2.3% 2013 43.1% 2013 31.6%
Zambia 2015 26.7% 2015 76.8% 2015 55.8%
Zimbabwe 2017 11.1% 2017 77.5% 2017 57.0%

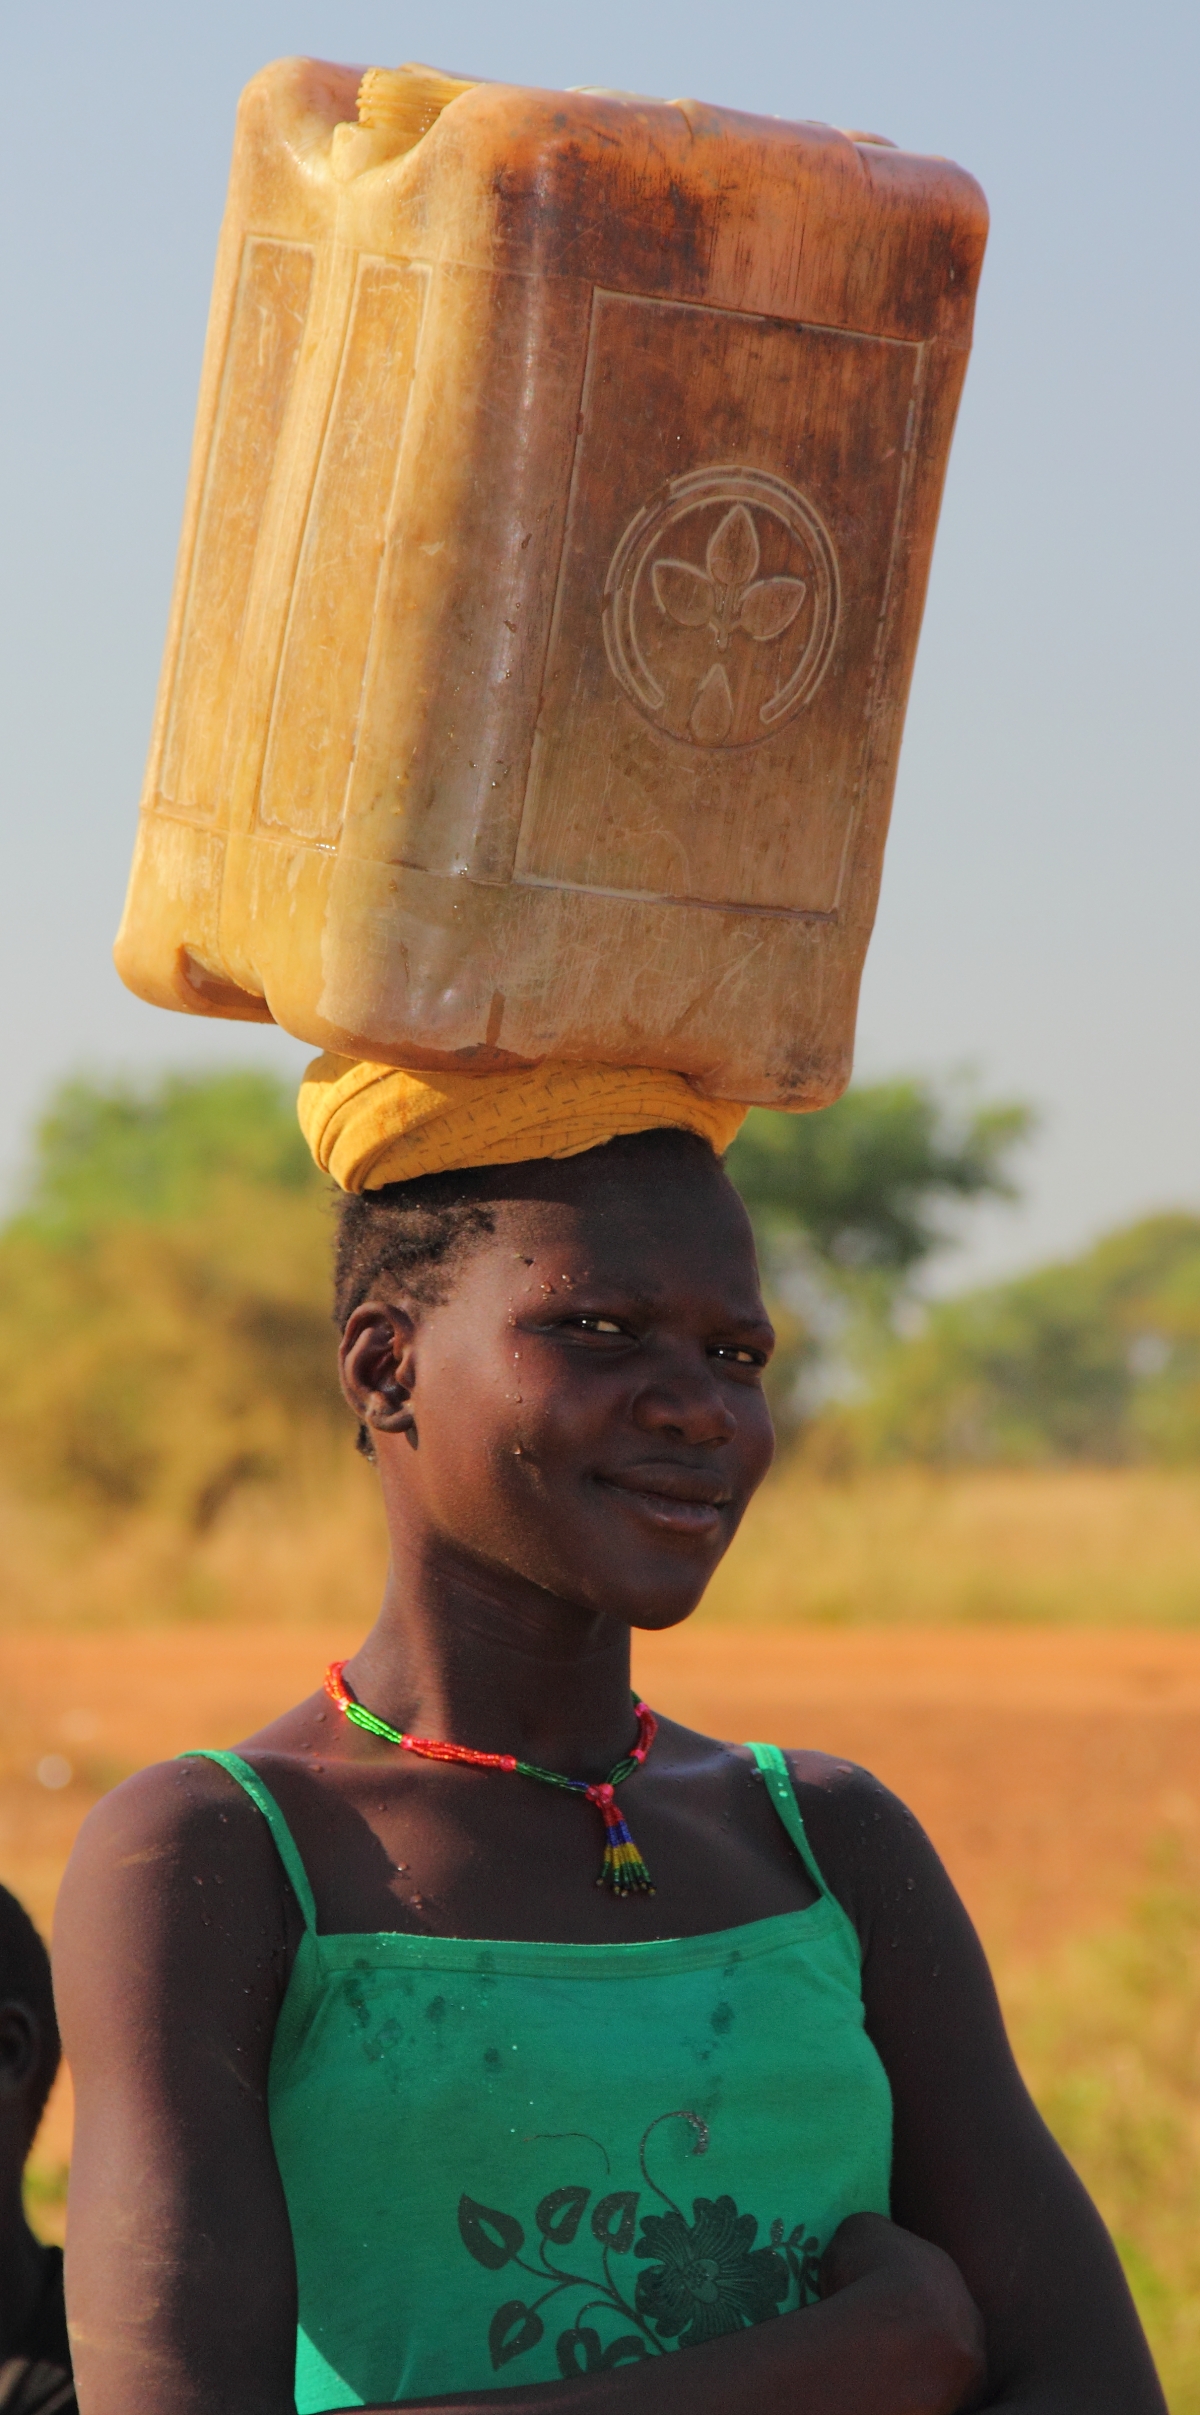
Photo:  Groundwater provides over 80% of the rural population with its main source of drinking water in South Sudan. Photo taken in 2014 in Northern Bahr el Ghazal by Kerstin Danert.


India pledges piped water to every rural home within 5 years

India is turning its back on the handpump and is going full bore for piped water supplies.

India is turning its back on the world’s most popular handpump to which it lent its name (India Mark II) and is going full bore for piped water supplies.

The Times of India report : “With more than 80% rural households yet to get piped water supply, the government on Tuesday announced to roll out a new mission to ensure “Nal se Jal”  ater from the tap) for each house in villages in the next five years as promised in BJP’s election manifesto.” 

This promises to be the most ambitious rural water supply programme in the world and this important transition from point source to piped will be watched with interest by many other countries around the world.

You can read more here:

Ne laisser personne de côté dans les zones rurales, c’est plus qu’une question d’approvisionnement en eau potable.

“Ne laisser personne de côté”. Que signifient réellement ces mots et quelles en sont les implications pour nous, les professionnels de l’eau en milieu rural, ainsi que pour le financement des programmes et des projets que nous mettons en œuvre ?

Le mot de la présidente du RWSN: Kelly Ann Naylor, UNICEF, Co-auteur : Dr Kerstin Danert, responsable du Thème Développement Durable des Eaux Souterraines de RWSN

Le thème de la Journée mondiale de l’eau de 2019, du World Water Development Report des Nations Unies, de la Semaine mondiale de l’eau à Stockholm et de la série de webinaires RWSN du printemps 2019 était le même : “Ne laisser personne de côté”. Que signifient réellement ces mots et quelles en sont les implications pour nous, les professionnels de l’eau en milieu rural, ainsi que pour le financement des programmes et des projets que nous mettons en œuvre ?

La résolution 70/1 de l’Assemblée générale des Nations Unies intitulée “Transformer notre monde : l’Agenda 2030 pour le développement durable” stipule qu’il ne faut laisser personne de côté. Cela nous demande d’analyser qui a été exclu de la prestation de services, de la prise de décision et du développement ; de découvrir pourquoi ; de déterminer ce qui peut être fait et de prendre des mesures pour que les personnes marginalisées dans le passé soient incluses maintenant et à l’avenir.  Deuxièmement, il s’agit de travailler de manière transversale entre disciplines et “thèmes de développement” pour combler les lacunes.

Permettez-moi d’illustrer le premier point par un exemple fictif : “Le pays X a connu une croissance économique rapide au cours des deux dernières décennies, qui s’est traduite par une amélioration substantielle de la richesse et du niveau de vie des populations dans trois des cinq régions du pays. Entre-temps, la vie de la majorité des habitants des deux autres régions, essentiellement rurales, n’a guère changé en cinquante ans. Une proportion non négligeable de la population y vit toujours dans l’extrême pauvreté et n’a pas de sécurité. L’écart de richesse entre les différentes régions du pays s’est creusé et, pour aggraver la situation, les populations les plus pauvres des régions les plus pauvres ont peu de voix ou d’influence dans la prise de décision au niveau national. L’objectif de Ne laisser personne de côté exige de demander au gouvernement et aux partenaires, ainsi qu’aux bailleurs de fonds, de comprendre pourquoi ces deux régions sont restées marginalisées, d’explorer ce qui peut être fait pour remédier au déséquilibre et de prendre des mesures. S’attaquer aux inégalités spatiales (géographiques) comme le montre l’exemple ci-dessus n’est qu’un exemple parmi d’autres des mesures prises pour ne laisser personne de côté. Selon le contexte, les inégalités se manifestent dans de nombreuses dimensions, y compris, mais sans s’y limiter, le sexe, la capacité, l’âge, l’origine ethnique, les castes et l’éloignement. Il peut également y avoir des chevauchements entre ces dimensions. 

Le deuxième point, qui porte sur le fait de travailler de manière transversale entre plusieurs thèmes de développement, est bien illustré dans les objectifs de développement durable (ODD) qui sont interdépendants.  Les professionnels de l’eau, de l’assainissement et de l’hygiène (WASH) peuvent se concentrer sur l’ODD 6 – Eau potable et assainissement, mais l’eau potable est directement intégrée dans l’ODD 1 – Mettre fin à la pauvreté (services de base), l’ODD 5 – Egalité des sexes (temps consacré au travail domestique non rémunéré, et femmes occupant des postes de direction) et l’ODD 4 – Éducation de qualité (Eau, Assainissement et Hygiène (EAH) dans les écoles). Tous ces éléments sont tout aussi importants que l’ODD 6.

Ce point est également ressorti d’une évaluation récente du programme d’approvisionnement en eau potable en milieu rural d’UNICEF: si nous voulons nous assurer que personne n’est laissé de côté et nous attaquer fondamentalement à la pauvreté rurale, nous devons, en tant que professionnels de l’eau en milieu rural, envisager de dépasser les limites de l’eau potable et du “monde de l’EAH”. Pour transformer la vie des populations, les infrastructures de l’eau doivent répondre à un plus large éventail de besoins ruraux – approvisionnement domestique, jardins familiaux, entreprises rurales et transformation rurale ainsi que l’eau potable. Nous devons aborder les questions de genre afin que les femmes et les enfants ne “fassent pas le travail d’un tuyau ” car ils passent une grande partie de leur vie à transporter de l’eau sur de longues distances. Nous devons veiller à ce que les personnes handicapées puissent satisfaire leurs besoins en eau et mener une vie digne.

D’ici la fin de l’année, l’UNICEF publiera de nouvelles directives sur l’équité dans le secteur de l’EAH. Nous espérons que cela contribuera non seulement aux efforts que vous entreprenez déjà, mais que ces directives pourront vous inspirer à faire encore plus pour remédier aux inégalités. Entre-temps, commencez à poser des questions sur les personnes qui sont laissées pour compte, ainsi que sur ce qui peut être fait et pourquoi. De plus, songez à contacter vos collègues et amis qui travaillent pour transformer le monde rural, ou sur les questions de genre, la nutrition et l’éducation pour voir s’il existe des moyens de travailler ensemble pour ne laisser personne de côté en milieu rural. 

Leaving no one behind in rural areas is about more than drinking water supplies

‘Leaving No One Behind’ – what do these words actually mean, and what are the implications for us rural water practitioners, as well as those funding the programmes and projects that we implement?

Word from the RWSN Chair: Kelly Ann Naylor UNICEF, Co-author: Dr Kerstin Danert, RWSN Sustainable Groundwater Development Theme Leader in the latest RWSN Update (June 2019)

The theme of the 2019 World Water Day, the United Nations World Water Development Report the World Water Week in Stockholm and the early 2019 RWSN webinar series was ‘Leaving No One Behind’. What do these words actually mean, and what are the implications for us rural water practitioners, as well as those funding the programmes and projects that we implement?

Leave No One Behind’ is stated in the UN General Assembly Resolution 70/1 entitled: Transforming our world: the 2030 Agenda for Sustainable Development.  Leave no one behind calls upon us to find out who has been excluded from service provision, decision-making and development; to find out why; to explore what can be done and to take action to ensure that people who have been marginalised in the past are included now, and in the future.  Secondly, it is about joining hands across disciplines and ‘development themes’ to address gaps.

Let me try to illustrate the first point with a fictitious example: “Country X has witnessed rapid economic growth over the last two decades, leading to substantial improvements in the wealth and living standards of people in three of the country’s five regions. Meanwhile, the lives of the majority of people in the other two, predominantly rural regions have barely changed over fifty years. A sizable proportion of the population there are still living in extreme poverty and have no safety net. The gap in wealth between different parts of the country has widened, and, to make matters worse, the poorest people in the poorest regions have little voice, or influence in decision-making at national level. Leave no one behind calls upon government and partners, as well as funders to understand why these two regions have remained marginalised, to explore what can be done to address the imbalance, and to take action. Addressing spatial (geographical) inequalities as shown in the above example is just one example of taking action to leave no one behind. Depending on the context, inequalities manifest themselves in many dimensions, including, but not limited to gender, ability, age, ethnicity, cast and remoteness. There may also be overlaps. 

The second point, about joining hands and working across development themes is well illustrated in the interlinked Sustainable Development Goals (SDGs).  Water, Sanitation and Hygiene (WASH) practitioners may focus on SDG 6 – Clean Water and Sanitation, but drinking water is directly embedded within SDG 1 – No Poverty (basic services), SDG 5 – Gender Equality (time spent on unpaid domestic and care work and women in managerial positions) and SDG 4 – Quality Education (WASH in schools). These are all just as important as SDG 6.

This point was also highlighted in a recent evaluation of the Rural Water Supply programme of UNICEF: if we are to ensure that no one is left behind and fundamentally tackle rural poverty, we, as rural water practitioners need to consider move beyond the confines of drinking water and ‘the WASH world’. To transform people’s lives, water infrastructures need to cater for a wider spectrum of rural needs – domestic supply, household gardens, rural businesses and rural transformation as well as drinking water. We must address gender issues so that women and children no longer ‘do the work of a pipe’ as they spend large parts of their lives hauling water over long distances. We must ensure that people with disabilities are able to meet their water needs and lead dignified lives.

By the end of 2019, UNICEF will publish new guidance on equity in WASH. We hope that this will not only contribute to the efforts that you are already undertaking, but that it can inspire you to do even more to address inequalities. In the meantime, start asking questions about who is being left behind, as well as why and what can be done. Moreover, consider reaching out to colleagues and friends working on rural transformation, gender transformation, nutrition and education to see if there are ways that you can work together to leave no one behind in rural areas. 

New JMP report offers fresh insights into rural water progress and challenges

The new JMP report is out with WASH data up to 2017! This is an initial look at some key points relating to rural water supply

The WHO/UNICEF Joint Monitoring Programme (JMP) is one of the central data and analysis resources for the WASH sector and each new report and data update is generally grabbed eagerly by WASH data geeks, like me.

This being RWSN, I’m specifically interested in rural water supply and what I present below is a hasty digest of some key facts and figures in the latest 2019 JMP report specifically relating to rural drinking water access.

I’m sure other WASH bloggers will also add the analysis, but I found the stuff on inequalities very interesting and useful. Some things that jumped out at me include:

  • What can we learn from Paraguay, Morocco and other countries that have made good progress?
  • Rural water supply challenges are not just about Sub-Saharan Africa: Papua New Guinea, the Solomon Islands, Fiji, Jamaica, Nicaragua and others are going backwards; and in terms of absolute numbers of people, China, India, Indonesia and Pakistan still have millions of rural people
  • Lower wealth quintiles often get left behind, but not always.
  • The new 3 elements of “Safely Managed” water are interesting and highlight an urgent need for systematic water quality monitoring – which a new RWSN Topic this year, as part of the Mapping & Monitoring Theme, thanks to our friends at the University of North Carolina.

Global Headline Facts & Figures

Here are some nuggets that will doubtless be seen in powerpoint presentations, funding proposals and journal papers over the coming year:

  • “2000-2017: Rural coverage of safely managed services increased from 39% to 53%. The gap between urban and rural areas decreased from 47 to 32 percentage points.”
  • “In 2017: 5.3 billion people used safely managed services. An additional 1.4 billion used at least basic services. 206 million people used limited services, 435 million used unimproved sources, and 144 million still used surface water.”
  • “46 out of 132 countries are on track to achieve ‘nearly universal’ basic water services by 2030, but rural areas and the poorest wealth quintiles have furthest to go”
  • “The greatest increase was recorded in Sub-Saharan Africa, where a quarter of the current population has gained access to at least basic drinking water since 2000”
  • In 2017: Eight out of ten people still lacking even basic services lived in rural areas. Nearly half lived in Least Developed Countries
  • “207 million people still used sources where water collection exceeded 30 minutes. Two thirds (135 million) of these people lived in countries in Sub-Saharan Africa but six out of eight SDG regions contained at least one country where >10% of the population used limited water services in 2017. The burden of water collection falls disproportionately on women.”

The report also reminds us that WASH is not just about SDG6, there are direct and indirect references in:

  • SDG 1.4 (No Poverty) its indicator 1.4.1 “Proportion of population living in households with access to basic services (including access to basic drinking water, basic sanitation and basic handwashing facilities)”
  • SDG 4.a (Education) and its indicator: 4.a.1 Proportion of schools with access to… (e) basic drinking water, (f) single-sex basic sanitation facilities, and (g) basic handwashing facilities
  • SDG 3.8 (Health) and its indicator on proportion of health care facilities with basic WASH services.

Since the emergence of SDG6.1 there has been a question about what “Safely Managed” water means. Well now there is some data available of the three elements chosen by the JMP team:

  • “Accessible on premises”
  • “Available when needed”
  • “Free from contamination”

However, there is only data for 14 countries for all three of these, but from those: “Between 2000 and 2017, water quality in rural areas improved from 42% to 53% free from contamination”

Regional/Country Progress and inequalities

Without doubt, the rural water supply star country is Paraguay: “Paraguay increased rural coverage of basic water from 53% to 99% and reduced the gap between richest and poorest by over 40 percentage points.”

Elsewhere:

  • “In almost all countries, service levels are higher in urban areas than in rural areas, but different patterns of inequality are observed.”
  • “In Latin America and the Caribbean, 12% of the rural population lacked basic water services in 2017, compared to 29% in 2000”
  • “In Haiti rural basic water coverage has increased among the richest but decreased among the poorest thereby widening the gap between them”
  • “In Nicaragua, rural basic water coverage has decreased among both groups.”
click to expand

Country progress to achieving Basic Rural Water Coverage by 2030 (figure above):

  • 16 countries on track, including: Morocco, Tajikistan, Lao PDR, Myanmar, Azerbaijan, Iraq, El Salvador, Kazakhstan, India, Vietnam, Tunisia, Brazil, Lithuania, Suriname, Panama. The most progress is being made by Morocco (+2.5%/year)
  • 61 countries are making progress, but too slowly.  The best progress is being made by Afghanistan and Mozambique (+2.1%/year)
  • 17 countries are going backwards, including: Iran, Fiji, Malaysia, North Korea, Serbia, Jamaica, Comoros, Gambia, Lesotho, Nicaragua, Guinea, Zimbabwe, Djibouti, Burkina Faso, Chad, Equatorial Guinea, Solomon Island. The biggest declines have been in Burkina Faso, Comoros and the Solomon Islands (-0.9%/year).

Which countries have the biggest rural water supply challenges?

The JMP data can examine this question in different ways – and a few new ones too. This is a quick-and-dirty dive into the data to look at which countries are struggling and should be given priority:

A column on water quality/contamination criteria is not included because the aggregated data for rural water is not available – and in many cases probably doesn’t exist.

These are just a few highlights, please take the time to read the report and explore the data portal.

Seawater intrusion – a challenge for the 21st century

This is a guest blog by Ramon Brentführer, which was originally published in GeoDrilling International. You can read the original article here.

Coastal zones have always formed focal points for human settlement and economic activity. Globally, some 37% of the world’s population lives within 100 km of the coast and two-thirds of the world’s cities are here with an extraordinary population growth. Water demand is rising and this is especially the case for coastal zones. Whereas China is considered to be the hotspot of this development with a projected population of about 200 million inhabitants in low elevation areas in 2030, the coastal area of India, Bangladesh, Indonesia and Vietnam also experience strong population growth. Furthermore, the population growth rates in Africa are estimated to be the highest worldwide, especially in countries of Western Africa. Moreover, changing lifestyles, agricultural expansion and economic development boost the demand for water in coastal areas. The growing need for water is a good business opportunity for drilling companies that drill wells for domestic, agricultural or industrial customers.

However, heavy groundwater abstraction in coastal zone is prone to problems: The vicinity of the water resources to the ocean represents a risk of salinization. When freshwater is abstracted from a well close to the coastline, seawater might intrude into the aquifer. The new publication “Groundwater Management in Coastal Zones” gives practitioners a guideline to evaluate risks and a scope for action in such sensible hydrogeological conditions and the dynamic physical and social environment of coastal zones.

2_Fig1

Seawater intrusion is not a future scenario – it is already reality in several regions worldwide. In Tianjin, one of the most rapidly developing and water scarcest regions in China, already 400 000 people were affected by salinity problems and 8000 irrigation wells were shut down. Some farmers continued to use groundwater for irrigation, which resulted in soil salinization and a reduction of farm yields by up to 60%. Dar es Salaam is one of Africa’s fastest growing urban centers. The city with currently 4.1 million inhabitants, is expected to reach more than 10 million inhabitants by 2030. Only half of the population is served with piped water. The remainder of the population, mostly living in informal and low-income settlements obtains its water from up to 10 000 unauthorized boreholes from the shallow aquifer under the city. This has caused seawater intrusion where chloride concentrations exceed the WHO drinking water standard of 250 mg/l. On the Balearic Island of Mallorca, the tourism industry has grown extensively with almost 10 million visitors in the year 2015, which is more than 10 times its number of residents. The high water demand in the dry summer month and the high permeability of the aquifers caused seawater intrusion. The list of cases for seawater intrusion is long and the reasons and drivers for seawater intrusion are divers and often interconnected.

Therefore, a sustainable groundwater management in a coastal zone is difficult but not impossible. A crucial pre-condition is the good understanding of the groundwater system, which requires a well-designed monitoring network. Experiences from different regions in the world have shown that there is an inadequate monitoring and lack of groundwater information. This includes static data, like aquifer properties, but also dynamic data like groundwater recharge and abstraction rates. A well-designed monitoring system and database form a further prerequisite for the enforcement of regulatory instruments like well licensing and abstraction permits. Another condition for a sustainable groundwater management is good governance. Groundwater governance is negotiated (formally or informally) between various actors and embedded in regional and local power relations. Therefore, the information about groundwater´s role in a regions economic development, cross-sectoral coordination and legislative enforcement is necessary to create good governance. Traditional command-and control-approaches generally fail to solve complex groundwater issues such as over-extraction. Consequently, integral and participatory approaches constitute the state-of-the-art in groundwater management. Therefore all relevant stakeholders, like water users, public administration, political groups, and financing institutions as well as scientific institutions and the private sector, should participate in the decision making process.

Different management approaches and solutions have been developed to tackle the challenge of a sustainable groundwater management. In South Downs in England or on the Pacific Island of Kiribati an optimized abstraction strategy prevents elevated groundwater salinity by monitoring and a limitation of the abstraction to available resources. An innovative approach for demand control measures has been tested in Oman, where the pumps of agricultural groundwater users were equipped with prepaid metering system. The principal aim should always be, to keep the demand for water as low as possible. Alternative complementary water resources like treated wastewater or desalination are emerging technologies . In some cases, the economic development of megacities has become so immense that water has to be transferred from other basins like in the city of Tianjin in China. Additional engineering approaches are physical or hydraulic barriers. In Los Angeles, treated wastewater is induced into coastal-near boreholes to create a hydraulic pressure .and hinder seawater to intrude into the aquifer.The application of these approaches depends very much on the local physical and social conditions but should be embedded in the two already mentioned preconditions: understanding of the groundwater system and good groundwater governance with an efficient and strong institutional framework. The limited capacity of groundwater systems to meet water demand needs a rethinking of water supply, which should be based on innovative solutions and a diversification of water sources. Water availability should be a guiding principle in economic development and spatial planning, and the focus should be not only be on direct human needs but also on the health of ecosystems. This balancing act will be a delicate one in many coastal regions, but it will have to be faced in order to meet the challenges brought by the rapid changes of the 21st century.

About the author

Ramon Brentführer is policy advisor for groundwater management in development cooperation at the Federal Institute for Geoscience and Natural Resources. He is a geologist and holds a master’s degree in integrated water resources management. Ramon is a co-author of the publication “Groundwater Management in Coastal Zones”.