by Afsana Afrin Esha, REACH Research Associate and PhD student at Durham University, re-blogged from REACH
Every year, the southwestern coastal zone of Bangladesh faces weather-related disasters, worsening a perpetual drinking water crisis. Cyclone Sidr in 2007 and Cyclone Aila in 2009 caused widespread destruction. While people were still recovering, Cyclone Amphan caused heavy damage to infrastructure and contamination. Saltwater intrusion due to cyclones and storm surges is having devastating consequences on groundwater and freshwater resources. Different water treatment options and alternative strategies are being applied by the local government institutions, NGOs and aid agencies, whilst informal or small water service providers too, are on the rise, addressing critical gaps in public investments in the rural water sector. However, in the face of rising climatic changes along with other socio-political factors, water shortages persist. In this short piece, I portray the effects of disaster on drinking water sources to understand the nuances of climate resilience.
This year we are celebrating 30 years since the Rural Water Supply Network was formally founded. From very technical beginnings as a group of (mostly male) experts – the Handpump Technology Network – we have evolved to be a diverse and vibrant network of over 13,000 people and 100 organisations working on a wide range of topics. Along the way, we have earned a reputation for impartiality, and become a global convener in the rural water sector.
RWSN would not be what it is today without the contributions and tireless efforts of many our members, organisations and people. As part of RWSN’s 30th anniversary celebration, we are running a blog series on rwsn.blog, inviting our friends and experts in the sector to share their thoughts and experiences in the rural water sector.
This is a blog post from RWSN Member Hannah Ritchie, based in the United Kingdom
—
In 2020, I joined forces with Sand Dams Worldwide (SDW) to help them answer the question of “how long water from sand dams is lasting throughout the year”. In this short blog post, I am happy to discuss with you our findings and the implications of this study. We’ll be discussing “why we are interested in this question”, “how we researched this question”, and “what we found out”.
Firstly though, for those of you not familiar with what a sand dam is, I would like to direct you here for a video, which explains them better than I could, and here to SDW’s website where you can find everything sand dam related you might need to know.
Why are we interested (and why you should be too)?
So, why do we care about whether sand dams are providing water year-round? There is uncertainty over whether water from sand dams is lasting all the way through the dry season, or whether people can only abstract water from sand dams at the beginning of the dry season, when they have just been replenished by the rains. Because of this conflict in results, we can’t easily conclude how effective sand dams are as a dryland and specifically dry season water source. For example, can people rely on them when other water sources are unavailable (such as when surface waters have run dry)? Or are the dams dry by the second week of the dry season? Answering this question is very important for understanding their level of use, acceptance, and financial viability, helping to inform future water management interventions and to ensure that communities are serviced with a continuous improved supply. Knowing whether there are certain dry season months when sand dams have no water being abstracted can also inform on months when water supply from other sources needs expanding. Finally, knowing which sand dams have more or less water being abstracted can aid in optimising sand dam design.
You might be thinking, “but no water abstracted doesn’t necessarily mean no water being available”, and you would be right. Because, whilst abstraction volumes may be linked to storage, many other variables, such as convenience, quality, and the use of other sources can also impact abstraction. Thus, the contribution that sand dams make to water security is not synonymous with the amount of water actually stored in the dam. Therefore, whilst this study can show us abstraction patterns from sand dams and therefore behaviours of use, it cannot confirm for certain whether there is or isn’t any water available.
How did we do it?
Now you know why we’re interested and why it matters, how did we actually go about answering the question: “how long water from sand dams is lasting throughout the year”? In 2019, 26 sand dam hand pumps in Makueni and Machakos Counties, Kenya were fitted with Waterpoint Data Transmitters (WDT) by ASDF. These devices measure the number of times and with what force a handpump is used over an hour and convert this into an estimated volume of water abstracted (Thomson et al., 2012). This data point is then transmitted by SMS. I had access to this remotely sensed data from April 2019 until October 2021. With a data point every hour for 26 sites over 31 months, I ended up with a very large data set!
Alongside this abstraction data, I also had access to interview and observation data provided by MSc student Joanna Chan, ASDF, and SDW. These variables included perceived salinity, abstraction limits, livestock use, whether the dam is said to have ever run dry, presence of rainwater harvesting tanks, actual salinity (μs/cm), area of dam wall (m2), average distance travelled from home to dam (km), and user numbers (Chan, 2019).
This data was then analysed to assess how much water people were abstracting and for how long throughout the year the water continued to be abstracted for. The variables collected from interview and observation were then analysed to provide insight into differences in abstraction between sites. For example, did sites with larger dam walls have more water being abstracted, or did salinity impact abstraction in any way?
Finally, we looked specifically at the last week in September (as a proxy for the end of the long dry season) to assess whether enough water to specifically meet drinking water needs (2 L/p/day) was still being abstracted at any sites. Due to the necessity of an improved source of water for drinking (of which a handpump is one), we wanted to know whether the handpumps could independently meet drinking water needs, in case no other water sources were available.
What did we find out?
After analysing all of the data and wrapping my head around some statistical analysis, I like to think that we found some interesting results.
The most obvious finding was that of high variability in abstraction volume between the 26 hand pumps and seasons. We found abstraction to be significantly higher in the long dry season, indicating a high reliance and delivery of water when other sources are compromised. The diagram below shows median monthly abstraction (L/month) (red line) and average monthly rainfall (mm) (brown bars – dry season and blue bars rainy season) across all sites – indicating higher abstraction when rainfall is lower.
There was abstraction data available from 21 handpumps (81%) by the end of at least one of the analysed long dry seasons, with at least some water still being abstracted. At 59.1% of these sites, enough water to meet each user’s drinking water needs (2 L/p/day) was being abstracted in at least one of the analysed years. This indicates that such dams can meet the drinking water needs of users independently of other sources.
Using the variables which were collected in interviews and observations, we found that sites with a greater proportion of people using the water for livestock, higher salinity, and larger dam walls had significantly higher levels of abstraction. This is to be expected as higher salinity sites are often used more for livestock (Chan, 2019), which have a greater water demand than that for drinking, whilst larger dam walls can lead to a greater volume of sand build up and therefore water storage (Maddrell & Neal, 2012).
These results highlight sand dams as a sustainable alternative to other dry season sources such as water vendors, which can be expensive and unreliable. However, lower abstraction in certain months and sites highlights that we must approach water management holistically. No one technique is necessarily the answer to dryland water security and all available water sources must be considered. Clearly, not all sand dams behave the same, with certain sand dams always likely to have higher levels of abstraction than others. However, high abstraction and sustained water availability by the end of the long dry season at many sites profess the positive contribution that sand dams can make to a community’s water supply, offering opportunities for further success in the future.
Closing remarks
I really hope you enjoyed learning about abstraction trends from sand dams as much as I enjoyed studying them (most of the time!) If you’re interested in learning more, I hope the paper will be published soon, which will be freely available for everyone to read. If you’d like to reach out, my email is hannah.ritchie@cranfield.ac.uk. Many thanks for reading.
A bit about the author
I am a PhD student at Cranfield University. I began my PhD in September 2019 in WaSH with the CDT Water WISER. With a background in geology and environmental engineering, I wanted to design my PhD project around earth sciences and development. This was how I ended up finding sand dams and partnering with SDW and Africa Sand Dam Foundation (ASDF).
Outside of work I love to run, hike (generally be outdoors as much as possible), read, and am learning French. I am very passionate about science communication and firmly believe that research results need to be translated into accessible formats for all to read and understand, hence why I have written this blog post for you (definitely shorter, more fun, and less boring than reading a 15-page paper!)
Did you enjoy this blog? Would you like to share your perspective on the rural water sector or your story as a rural water professional? We are inviting all RWSN Members to contribute to this 30th anniversary blog series. The best blogs will be selected for publication. Please see the blog guidelines here and contact us (ruralwater[at]skat.ch) for more information. You are also welcome to support RWSN’s work through our online donation facility. Thank you for your support.
Photo credits: Hannah Ritchie
References
Chan, J. (2019). Abstraction of Water from Sand Dams in Machakos and Makueni Counties (Kenya) via Handpumps.
Maddrell, S., & Neal, I. (2012). Sand Dams: a Practical Guide.
Thomson, P., Hope, R., & Foster, T. (2012). GSM-enabled remote monitoring of rural handpumps: A proof-of-concept study. Journal of Hydroinformatics, 14(4), 829–839. https://doi.org/10.2166/hydro.2012.183
Este año celebramos los 30 años de la fundación formal de la Red de Abastecimiento de Agua en Zonas Rurales. Desde unos inicios muy técnicos como grupo de expertos (en su mayoría hombres) la Red de Tecnología de Bombas de Mano- hemos evolucionado hasta convertirnos en una red diversa y vibrante de más de 13.000 personas y 100 organizaciones que trabajan en una amplia gama de temas. En el camino, hemos ganado una reputación de imparcialidad, y nos hemos convertido en un convocante global en el sector del agua rural.
La RWSN no sería lo que es hoy sin las contribuciones y los incansables esfuerzos de muchos de nuestros miembros, organizaciones y personas. Como parte de la celebración del 30º aniversario de la RWSN, estamos llevando a cabo una serie de blogs en rwsn.blog, invitando a nuestros amigos y expertos del sector a compartir sus pensamientos y experiencias en el sector del agua rural.
Esta es una entrada de blog del miembro de la RWSN Joshua Briemberg, con sede en Nicaragua.
Mi carrera en el sector del agua y el saneamiento comenzó en 1993, poco después de que naciera la RWSN. Fue una elección deliberada para mí después de un breve período en la industria petrolera del Reino Unido que siguió a vivir y trabajar durante 4 meses entre 1991 y 1992 en la zona rural de Nicaragua para construir una casa escuela de dos habitaciones. Durante ese tiempo, la diarrea estaba a la orden del día, y de la noche, en una rudimentaria letrina de pozo. Todavía recuerdo que miraba a las hojas de plátano gigantes que se agitaban a la luz de la luna para encontrar una sensación de paz en cierta agonía. En aquella época, luchaba por concentrarme mientras estaba en la universidad en Canadá, entre los estudios de ingeniería química, con una clase de tratamiento del agua que me llamaba la atención, y los estudios de humanidades, intrigado por el debate sobre los derechos del agua y los pueblos de las Primeras Naciones de Canadá.
Una vez terminada mi carrera de ingeniería en 1992, mi verdadera vocación siguió eludiéndose y me trasladé al Reino Unido. Durante mi estancia en Londres, primero como mensajero en bicicleta y luego como ingeniero de salud y seguridad para la construcción de una plataforma petrolífera de 11.000 millones de dólares en el Mar del Norte, la librería Intermediate Technology (que más tarde se convertiría en Practical Action) se convirtió en mi destino favorito y la publicación mensual Waterlines en una temprana inspiración, mientras planeaba volver a Nicaragua para hacer algo, cualquier cosa relacionada con el agua. También recuerdo haber llevado algún que otro paquete como mensajero a una pequeña oficina de WaterAid en un edificio cercano a Green Park. Veinte años más tarde, todavía viviendo en Nicaragua, se me pediría que diseñara y luego dirigiera el primer programa de país de WaterAid en América Latina.
En algún momento, dejé de lado cualquier idea de seguir una formación formal en las aulas de institutos de renombre como el WEDC de la Universidad de Loughborough, donde una vez me reuní con John Pickford, o el IHE de Delft, donde también hice una breve visita. El campo se convertiría en mi aula.
Mi andadura en el mundo del agua y el saneamiento en 1993 empezó de verdad al realizar un estudio sobre la presencia de pesticidas en las aguas subterráneas de las ciudades del histórico cinturón algodonero de Nicaragua en los años setenta. De ahí pasé a un par de trabajos en lo que iba a ser mi campo como ingeniero químico: planes maestros de alcantarillado para Managua y tratamiento de aguas residuales mientras estaba brevemente en Canadá.
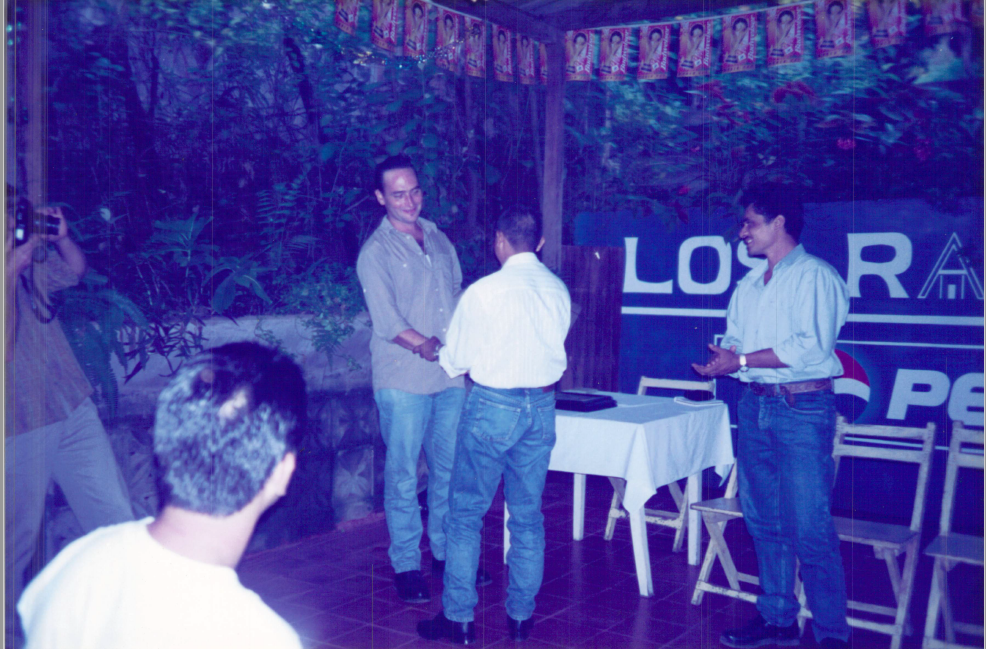
Foto: Clase de graduados de Agua para la Vida
Pero fue entonces, cuando me encontré dirigiendo el primer ciclo de un programa de formación de ingenieros de pueblos para diseñar y construir pequeños sistemas rurales de abastecimiento de agua por gravedad alimentados por manantiales en las montañas del centro-norte, cuando realmente encontré mi vocación: el abastecimiento de agua en zonas rurales. En poco más de 30 años esta operación –Agua para la Vida– ha trabajado con pequeñas comunidades rurales de montaña para establecer más de 100 sistemas de abastecimiento de agua utilizando herramientas de diseño de última generación para optimizar el rendimiento y el coste. Los sistemas de abastecimiento de agua por gravedad alimentados por manantiales de montaña bien diseñados son asombrosamente duraderos con unos costes de funcionamiento muy manejables; el principal reto es la protección de la zona de recarga de la cuenca y garantizar la cohesión de la comunidad y una gestión eficaz.
Cautivado por la alegría de abrir el grifo y tener agua limpia a borbotones después de meses de sudor y esfuerzo, me sentí impulsado a seguir en la búsqueda de un vaso de agua limpia en todas partes.
Una cosa que descubrí durante estos años fue que, mientras diseñábamos para el crecimiento, las comunidades a menudo se reducían en tamaño debido a la migración en busca de mayores oportunidades económicas en otros lugares.
Aproveché los conocimientos aprendidos con las comunidades devastadas por la guerra en la frontera agrícola para trabajar con las comunidades indígenas Miskitu y Mayangna para llevar agua limpia de montaña a la gente a lo largo de un sistema de ríos en las profundidades más lejanas de una de las dos reservas de la biosfera en Nicaragua. El suministro de agua por tubería alimentada por gravedad siguió siendo mi opción por defecto hasta que se agotaron los manantiales.
En mi primera misión de reconocimiento, en 1997, en la aldea de Raiti, en el río Coco (Wangki), que separa Honduras de Nicaragua, me acompañó un hidrogeólogo estadounidense que no hablaba ni español ni la lengua local, el Miskitu. Durante la conversación con los líderes de la comunidad sobre la existencia de fuentes potenciales de manantiales, un líder de la comunidad me dijo que la fuente potencial estaba a unos 15 minutos de distancia mientras que otro dijo que estaba más bien a un día de distancia. Ni que decir tiene que mi hidrogeólogo decidió quedarse atrás y tardamos cerca de 6 horas en llegar al lugar que los aldeanos consideraban una fuente viable.
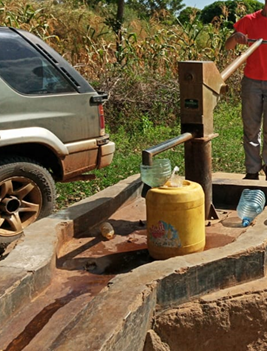
Desafortunadamente, como casi todas las fuentes de agua superficiales en la región oriental o caribeña de Nicaragua, estaba situada a una altura inferior a la de la comunidad, que era la forma en que las comunidades se protegían contra el riesgo de inundaciones. Y así comenzaron mis primeras experiencias de excavación y perforación de pozos con lo que para entonces se había convertido en un estándar nicaragüense: la bomba de mecate.
Transportando tubos en el Río Coco (2000-2003)
No fue hasta principios de la década de 2000, y con una década de experiencia empírica sobre el terreno, cuando empecé a entrar en contacto con redes como la RWSN, que se convirtieron en referencias esporádicas pero importantes, combinadas con otros focos de inspiración que encontraba en las escasas oportunidades en que salía de comunidades remotas por senderos, caminos de tierra y ríos.
A través de estos contactos, me inspiré para añadir nuevas herramientas a mi caja de herramientas en la búsqueda continua de agua limpia. La recogida de agua de lluvia y el tratamiento en el punto de uso o los filtros se convirtieron en aspectos importantes de mi búsqueda para llegar realmente a la última milla, al tiempo que experimentaba con bombas hidráulicas de ariete en el camino. Además de las tecnologías en sí, enfoques como el Marco de Aplicabilidad de la Tecnología (TAF), la aceleración del autoabastecimiento y el fortalecimiento de los sistemas se han convertido en herramientas esenciales en los últimos diez años de mi viaje.
De estos contactos surgieron no sólo referencias técnicas clave, sino una mayor comprensión de la importancia del contexto en la aplicabilidad de una solución, la complejidad de la sostenibilidad, la importancia de los enfoques basados en la demanda acompañados de sistemas que no son necesariamente exclusivos del sector público, sino que incluyen el papel del sector privado local, el espíritu empresarial, las alianzas y la aceleración de los modelos de autoabastecimiento de la prestación de servicios.
Todavía existe una tensión considerable entre estos dos enfoques del suministro de agua -el fortalecimiento de los sistemas y la aceleración de los modelos de autoabastecimiento-, aunque considero que estos últimos son complementarios y forman parte de los primeros, y a pesar de que en el ámbito del saneamiento las soluciones familiares individuales siguen siendo la norma para la población de las zonas rurales.
Ni que decir tiene que pasé de mis inicios en los sistemas de abastecimiento por gravedad alimentados por manantiales a los pozos de sondeo superficiales y profundos, a la perforación manual y mecánica, a las bombas manuales y a las impulsadas por energías renovables, a la captación de agua de lluvia en los tejados y al tratamiento y almacenamiento de agua en los hogares. También me adentré en el concepto de resiliencia y en los conceptos de usos múltiples y fuentes múltiples o sistemas híbridos, este último todavía menos considerado.
No debe pasar desapercibido que mi búsqueda de agua limpia en Nicaragua se ha visto confrontada y marcada en el camino por un número creciente de huracanes: Mitch en 1998, que me llevó al río Coco para construir sistemas de abastecimiento de agua donde no los había, pero donde las comunidades a lo largo del río habían sido totalmente arrasadas. Félix, en 2007, dejó una franja de destrucción en la costa caribeña nororiental. Y, más recientemente, Eta e Iota, en noviembre de 2020, arrasaron con todos los más de 250 sistemas de captación de agua de lluvia en los tejados, con tanques de ferrocemento de 4.000 litros, que habían sido construidos uno a uno durante 5 años por hombres y mujeres en la comunidad de Wawa Bar.
Training RWH System installers Wawa Boom (2021)
En el camino, también me encontré con algunas contribuciones significativas al abastecimiento de agua en las zonas rurales, incubadas en Nicaragua en el espíritu de su afamado poeta de las letras españolas modernas Rubén Darío: Si la Patria es pequeña, uno grande la sueña. Entre ellas se encuentran la bomba de mecate, el filtron de barro (Filtron) y un clorador en línea de fabricación artesanal (conocido originalmente como CTI-8).
Fueron el tratamiento y el almacenamiento de agua en el hogar y Ron Rivera, de Alfareros por la Paz, los que me iniciaron en el concepto de autoabastecimiento y los enfoques basados en el mercado. Este concepto ha terminado por costarme dos veces mi trabajo con organizaciones “sin ánimo de lucro” que no están dispuestas a socavar su modelo de caridad y su dependencia de un estado permanente de “filantropía humanitaria”.
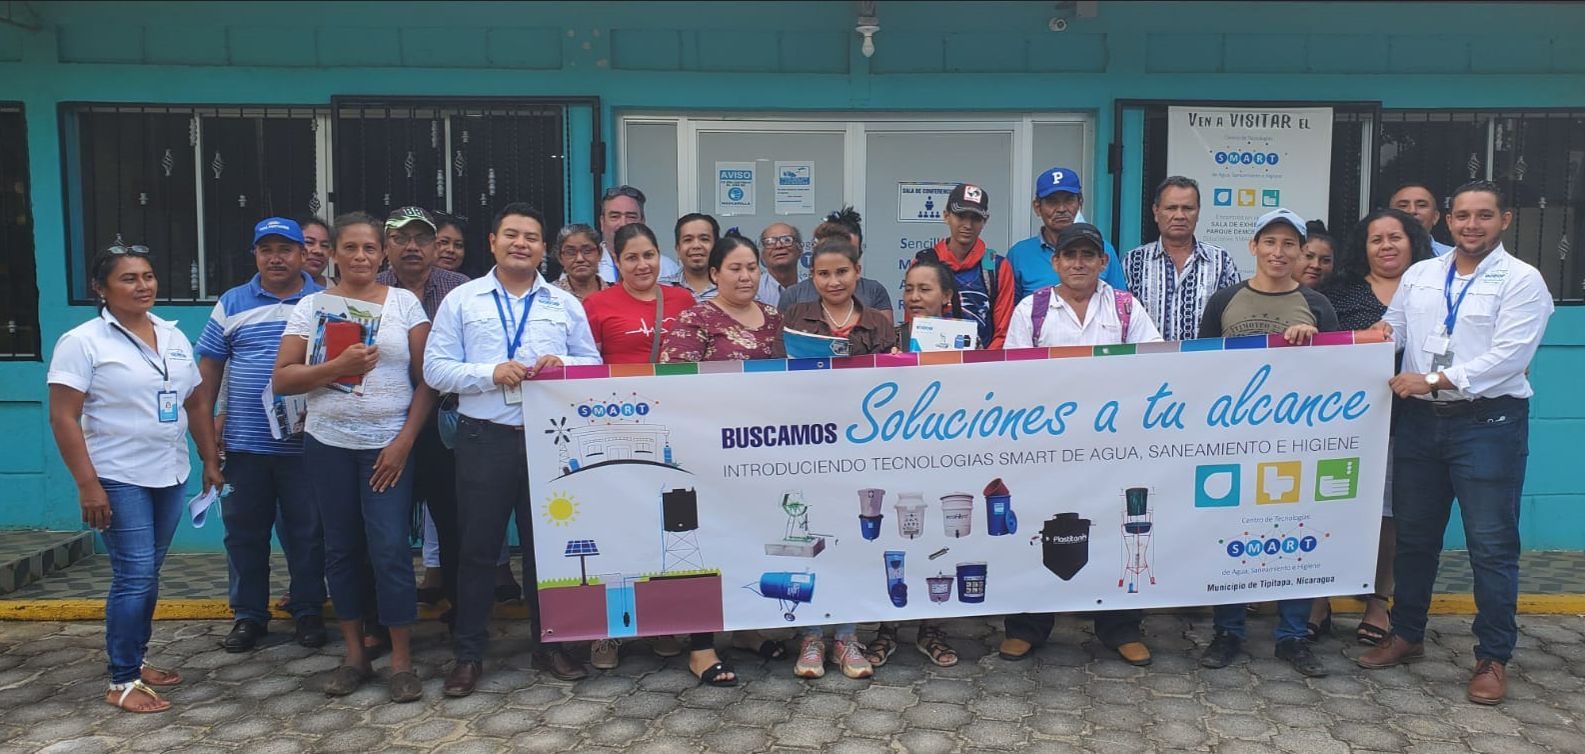
Ahora que mi camino de vida entra en su recta final, mi enfoque es reunir tanto física como virtualmente la mayor cantidad de todas estas grandes iniciativas y las nuevas que surjan, dentro de un marco basado en el contexto y la construcción colectiva de modelos de prestación de servicios adecuados. Mi vehículo desde 2017 es el Centro SMART de Nicaragua: Conectando, asistiendo, acelerando. El Centro SMART fue inspirado en 2015 por Henk Holtslag, a quien conocí en el Foro de la RWSN en Kampala en 2011.
Joshua ha trabajado como profesional en el sector de WASH rural durante más de 30 años, casi en su totalidad en Nicaragua, América Central, con la excepción de un período de 3 años en el que dirigió el desarrollo de un programa en Colombia. Su trabajo le ha llevado desde breves periodos en el sector público y en una empresa privada de consultoría de ingeniería, hasta organizaciones no gubernamentales pequeñas e internacionalmente reconocidas, y agencias de ayuda bilateral. Es el director fundador del Centro de Tecnologías SMART de Agua, Saneamiento e Higiene de Nicaragua, una empresa social que reúne a los sectores público y privado, las instituciones de microfinanciación y el mundo académico para promover los enfoques SMART, incluido el autoabastecimiento para llegar a la última milla. Recientemente ha sido coautor de una nota de campo de la RWSN en la que se hace un balance de los 40 años de historia de la bomba de mecate en Nicaragua.
¿Le ha gustado este blog? ¿Le gustaría compartir su perspectiva sobre el sector del agua rural o su historia como profesional del agua rural? Invitamos a todos los miembros de la RWSN a contribuir a esta serie de blogs del 30º aniversario. Los mejores blogs serán seleccionados para su publicación y traducción. Por favor, consulte las directrices del blog aquí y póngase en contacto con nosotros (ruralwater[at]skat.ch) para obtener más información.Si aprecia el trabajo de la RWSN y desea apoyarnos económicamente, puede hacerlo aquí.
This year we are celebrating 30 years since the Rural Water Supply Network was formally founded. From very technical beginnings as a group of (mostly male) experts – the Handpump Technology Network – we have evolved to be a diverse and vibrant network of over 13,000 people and 100 organisations working on a wide range of topics. Along the way, we have earned a reputation for impartiality, and become a global convener in the rural water sector.
RWSN would not be what it is today without the contributions and tireless efforts of many our members, organisations and people. As part of RWSN’s 30th anniversary celebration, we are running a blog series on rwsn.blog, inviting our friends and experts in the sector to share their thoughts and experiences in the rural water sector.
This is a blog post from RWSN Member Joshua Briemberg, based in Nicaragua.
My career in the water and sanitation sector started in 1993 not long after RWSN was born. It was a deliberate choice for me after a brief stint in the UK oil industry that followed upon living and working during 4-months between 1991 and 1992 in rural Nicaragua to build a two-room school house. During this time diarrhea was often the order of the day, and night, for me in a rudimentary pit latrine. I still remember looking up into giant banana leaves waving in the moonlight to find a sense of peace in certain agony. At the time, I struggled to focus while in university in Canada between studies in chemical engineering with one class in water treatment that caught my attention, and studies in humanities, intrigued by the discussion of water rights and the First Nations people of Canada.
Having finished my engineering degree in 1992, my true calling continued to elude me and I moved to the UK. While in London, first as a bicycle courier and then as a health and safety engineer for the construction of an 11 billion dollar North Sea oil platform, the Intermediate Technology book shop (which later became Practical Action) became my favorite destination and the monthly publication Waterlines an early inspiration, as I planned a return to Nicaragua to do something, anything related to water. I also remember carrying the odd parcel as a courier to a small WaterAid office in a building near Green Park. Twenty years later, still living in Nicaragua I would be asked to design and then lead WaterAid’s first country program in Latin America.
Somewhere along the way, I let fall by the wayside any idea of pursuing further formal training in the halls of renowned institutes like WEDC at the University of Loughborough, where I once met with John Pickford, or IHE in Delft where I also made a short visit. The field was to become my classroom.
My journey in the world of water and sanitation in 1993 started for real by conducting a study of the presence of pesticides in the groundwater supplies for the cities of Nicaragua’s historic cotton-belt of the 1970s. I moved on from there to a couple of jobs in what was meant to be my field as a chemical engineer – sewerage master plans for Managua and wastewater treatment while briefly back in Canada.
Photo: Agua Para la Vida Graduating Class
But it was then, as I found myself heading up the first cycle of a program to train village-engineers to design and build small rural spring-fed gravity-driven water supply systems in the north-central mountains that I truly found my calling: rural water supply. In just over 30 years this operation – Agua para la Vida – has worked with small rural mountainous communities to establish more than 100 water supply systems using state-of-the-art design tools to optimize performance and cost. Well-designed mountain spring-fed gravity-driven water supply systems are amazingly durable with highly manageable operating costs; the main challenge is the protection of the recharge area of the watershed and ensuring community cohesion and effective management.
Captivated by the joy of opening the tap and having clean water gushing out after months of sweat and toil, I was driven to carry on in pursuit of a glass of clean water everywhere.
One thing I found during these years was that while we designed for growth the communities often shrunk in size due to migration in search of greater economic opportunities elsewhere.
I took the skills learned with war-ravaged communities on the agricultural frontier to work with indigenous Miskitu and Mayangna communities to bring clean mountain water to people along a system of rivers in the farthest depths of one of two biosphere reserves in Nicaragua. Gravity-fed piped water supplies continued to be my default option until the springs ran out.
On my first reconnaissance mission in 1997 to the village of Raiti on the Coco River (Wangki) that separates Honduras from Nicaragua, I was accompanied by an American hydrogeologist who spoke neither Spanish nor the local language Miskitu. During the conversation with community leaders about the existence of potential spring sources, one community leader told me that the potential source was about 15 minutes away while another said it was more like a day away. Needless to say my hydrogeologist decided to stay behind and it took us close to 6 hours to reach the place thought by the villagers to be a viable source!
Unfortunately, like almost all surface water sources in the eastern or Caribbean region of Nicaragua, it was located at lower elevations than the community, which was the way the communities would protect themselves against the risk of flooding. And thus began my first experiences with digging and drilling wells with what had become a Nicaraguan standard by then: the rope pump.
Transporting pipes on the Rio Coco (2000-2003)
It was not until the early 2000s, and with a decade of empirical experience in the field, that I began to come in contact with networks such as RWSN which became sporadic but important references combined with other guiding lights of inspiration that I encountered in the rare opportunities when I emerged from remote communities by footpaths, dirt roads, and rivers.
Through these contacts, I was inspired to add new tools to my toolbox in the continued search for clean water. Rainwater harvesting and point-of-use treatment or filters became significant aspects of my search to truly reach the last mile, while also experimenting with hydraulic ram pumps along the way. In addition to technologies themselves, approaches such as the Technology Applicability Framework (TAF), accelerating self-supply, and systems strengthening have become essential tools in the last ten years of my journey.
In addition to RWSN, which I did not formally encounter until 2011 when I attended the RWSN’s 6th International Forum in Kampala, Uganda, I also found inspiration from the HWTS network, the International Rainwater Harvesting Alliance (IRHA), the SMART Centre Group, SuSanA, Agenda for Change, and others. At the local level the Nicaraguan and Central American WASH Networks (RASNIC and RRAS-CA respectively) represented efforts to bring collaboration to the regional, national and local levels.
Out of these contacts came not only key technical references, but a greater understanding of the importance of context in the applicability of a solution, the complexity of sustainability, the importance of demand-based approaches accompanied by systems that are not necessarily exclusive to the public sector but include the role of the local private sector, entrepreneurship, alliances and the acceleration of self-supply models of service delivery.
There is still considerable tension between these two approaches to water supply – systems strengthening and accelerating self-supply models – although I consider the latter to be complementary and part of the former, and despite the fact that in sanitation individual family solutions continue to be the standard for the population in rural areas.
Needless to say, I moved on from my beginnings in spring-fed gravity-driven systems to shallow and deep borehole wells, manual and machine drilling, handpumps and renewable energy-driven pumps, rooftop rainwater catchment, and household water treatment and storage. I also ventured in to the concept of resilience and the concepts of both multiple uses and multiple sources or hybrid systems, the latter still less commonly considered.
It should not go unnoticed that my search for clean water in Nicaragua has been both confronted and marked along the way by an increasing number of hurricanes: Mitch in 1998 that took me to the Coco River to build water supply systems where there had been none but where the communities along the river had been entirely wiped away. Felix in 2007 left a swath of destruction across the northeast Caribbean Coast. And most recently Eta and Iota back-to-back in November 2020 that wiped out all of the more than 250 rooftop rainwater catchment systems with 4,000 litre ferrocement tanks that had been built one by one over 5 years by men and women in the community of Wawa Bar.
Training RWH System installers Wawa Boom (2021)
On this journey, I also came across some significant contributions to rural water supply incubated in Nicaragua in the spirit of its famed poet of modern Spanish letter Ruben Dario: Si la Patria es pequeña, uno grande la sueña. (If the homeland is small, one dreams it to be grand.) These include the rope pump (known in Nicaragua as the bomba de mecate), the clay pot filter (Filtron), and an artisan-made in-line chlorinator (originally known as CTI-8).
It was household water treatment and storage, and Ron Rivera of Potters for Peace that started me on the road to the concept of self-supply and market-based approaches. This concept has ended up twice costing me my job with “non-profit” organizations unwilling to undermine their charity model and dependence on a permanent state of “humanitarian philanthropy”.
Now as my life journey enters its home stretch, my focus is on bringing together both physically and virtually as many of all these great initiatives and new ones as they come along, within a context-based framework and the collective construction of appropriate service delivery models. My vehicle since 2017 is the Nicaragua SMART Centre: Connecting, assisting, accelerating. The SMART Centre was inspired in 2015 by Henk Holtslag whom I first met that the RWSN Forum in Kampala in 2011.
Joshua has worked as a practitioner in the rural WASH sector for over 30 years almost entirely in Nicaragua, Central America with the exception of a 3-year period when he led the development of a program in Colombia. His work has taken him from brief stints in the public sector and with a private engineering consulting firm, to both small and internationally recognized non-governmental organizations, and bilateral aid agencies. He is the founding director of the Nicaragua Centre for SMART Technologies for WASH (Centro de Tecnologías SMART de Agua, Saneamiento e Hygiene), a social enterprise bringing together the public and private sectors, microfinance institutions, and academia to promote SMART approaches including self-supply to reach the last mile. He recently co-authored a RWSN Field Note taking stock of the 40-year history of the rope pump in Nicaragua.
Did you enjoy this blog? Would you like to share your perspective on the rural water sector or your story as a rural water professional? We are inviting all RWSN Members to contribute to this 30th anniversary blog series. The best blogs will be selected for publication. Please see the blog guidelines here and contact us (ruralwater[at]skat.ch) for more information. You are also welcome to support RWSN’s work through our online donation facility. Thank you for your support.
Este año celebramos los 30 años de la fundación formal de la Red de Abastecimiento de Agua en Zonas Rurales. Desde unos inicios muy técnicos como grupo de expertos (en su mayoría hombres) la Red de Tecnología de Bombas de Mano- hemos evolucionado hasta convertirnos en una red diversa y vibrante de más de 13.000 personas y 100 organizaciones que trabajan en una amplia gama de temas. En el camino, hemos ganado una reputación de imparcialidad, y nos hemos convertido en un convocante global en el sector del agua rural.
La RWSN no sería lo que es hoy sin las contribuciones y los incansables esfuerzos de muchos de nuestros miembros, organizaciones y personas. Como parte de la celebración del 30º aniversario de la RWSN, estamos llevando a cabo una serie de blogs en rwsn.blog, invitando a nuestros amigos y expertos del sector a compartir sus pensamientos y experiencias en el sector del agua rural.
Este blog fue escrito por nuestro miembro de RWSN, Jaime Aguirre, de Bilbao, España.
EMAS es el acrónimo de “Escuela móvil del agua y saneamiento”; fue acuñado en los años 80 en Bolivia por Wolfgang Buchner, con el apoyo de un grupo de voluntarios
La misión principal de EMAS es enseñar a las familias a obtener agua limpia por sí mismas. El “aprendizaje práctico” es la forma más óptima de aprender estas técnicas.
El programa WaSH de EMAS incluye varias tecnologías Do-It-Yourself, como la bomba manual EMAS, la perforación manual de pozos de hasta 90 metros, tanques de almacenamiento de agua y los aseos VIP, entre otros. Todas las tecnologías han estado en constante desarrollo desde los años 90. Se han implantado en más de 25 países, principalmente en América Latina y África. La biblioteca de la RWSN alberga documentación y evaluaciones del uso de las tecnologías EMAS en Uganda, Sierra Leona, Panama y Bolivia, entre otros.
El objetivo de las tecnologías de EMAS es facilitar el acceso al agua potable y al saneamiento mediante la formación de técnicos locales y beneficiarios. Estas formaciones son cursos compactos en los que durante varias semanas se muestran y practican todas las técnicas. A largo plazo, todas las instalaciones pueden ser mantenidas por el usuario debido a la simplicidad de la tecnología. El resultado:
Mejora del acceso al agua potable para las poblaciones rurales del mundo, combinada con instalaciones sanitarias sencillas, evitando así la propagación de enfermedades infecciosas y reduciendo las tasas de mortalidad.
Aumento de la calidad de vida, por ejemplo, al eliminar el laborioso acarreo de agua, lo que ahorra tiempo a las mujeres y los niños y permite realizar pequeños trabajos agrícolas.
Los constructores de pozos formados son autosuficientes e independientes, y pueden, si es necesario, recibir más asesoramiento y formación.
Sostenibilidad: Los pozos y las instalaciones de agua son muy asequibles. La experiencia ha demostrado que los propietarios mantienen bastante bien las instalaciones, lo que se traduce en una larga vida útil. Las reparaciones que puedan ser necesarias suelen ser fáciles de realizar.
Todos los materiales necesarios para estas reparaciones pueden obtenerse localmente.
Los materiales y los métodos son respetuosos con el medio ambiente y la mayoría de los pasos se realizan manualmente.
La extracción de cantidades moderadas de agua y su uso disciplinado no tienen un impacto negativo en el medio ambiente ni en los niveles de agua subterránea.
Mejora de las oportunidades para que las personas permanezcan en sus regiones de origen de forma permanente.
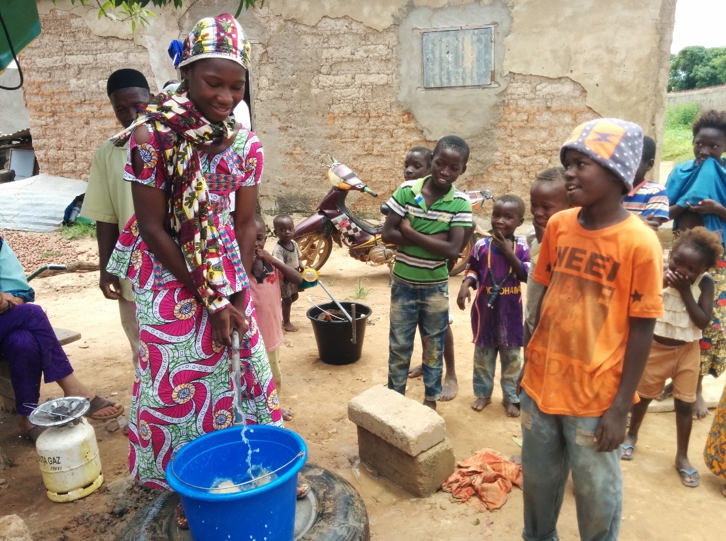
La bomba manual EMAS es el componente clave de las tecnologías EMAS porque es capaz de bombear agua verticalmente hasta 50 m. Mientras que otras bombas manuales tienen una mayor resistencia al uso intensivo o incluso inapropiado (muchas veces cuando la bomba está siendo utilizada por toda una comunidad), la bomba EMAS está diseñada principalmente para el uso doméstico. Las bombas EMAS tienen una larga vida útil, ya que las reparaciones que puedan ser necesarias suelen ser fáciles de realizar por el usuario.
Las instrucciones en vídeo pueden verse en nuestro canal de YouTube que cuenta con unos 15.000 seguidores y algunos vídeos tienen más de 700.000 visitas.
A veces hay que hacer adaptaciones de las tecnologías en algunos países debido a la disponibilidad de material.
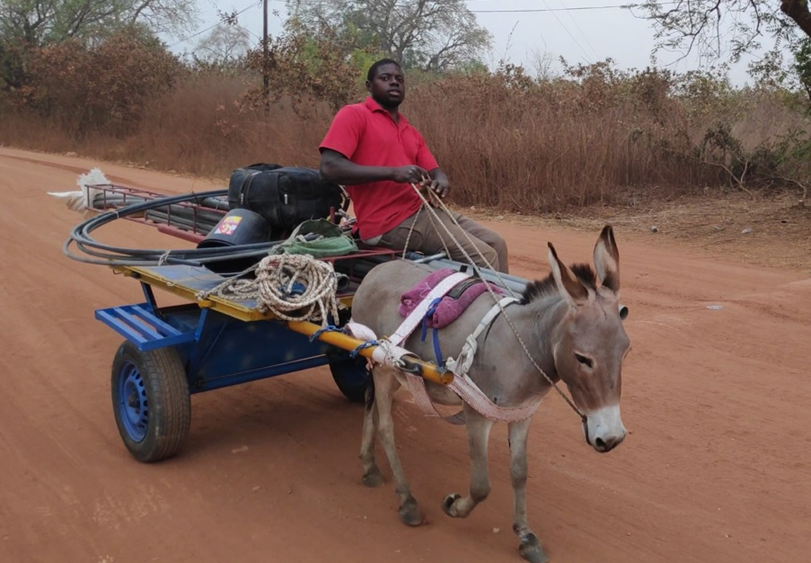
Amadou, técnico de Senegal marchando con su equipo de perforación a hacer un nuevo pozo
Por el momento, se han perforado aproximadamente 70.000 pozos EMAS en todo el mundo. La mayoría han sido financiados por las familias o los beneficiarios. Desde los años 80, más de 100 técnicos formados han creado una microempresa que ofrece servicios WASH a su comunidad. Las tecnologías de EMAS se han implantado en más de 25 países a través de cooperaciones con diversas organizaciones locales e internacionales (por ejemplo, OPS). Como resultado de la cooperación con Welthungerhilfe se han perforado más de 3.000 pozos EMAS en Sierra Leona.
EMAS pretende asociarse con organizaciones que incluyan WASH en sus programas y que también deseen implementar las tecnologías mencionadas a través de proyectos de formación en WASH. Los proyectos deben incluir un seguimiento y apoyo a los técnicos WASH formados durante su camino para convertirse en PYMES. Muchos casos demuestran que los trabajadores de las PYMES crean su propia empresa y sirven a otras regiones que tienen una gran demanda de servicios WASH.
A corto plazo, se lanzará una página de aprendizaje de EMAS para compartir todas las experiencias en varios países y también facilitar todo el material disponible. Esta página también se dirigirá a los usuarios con conocimientos técnicos que deseen aprender más sobre las tecnologías.
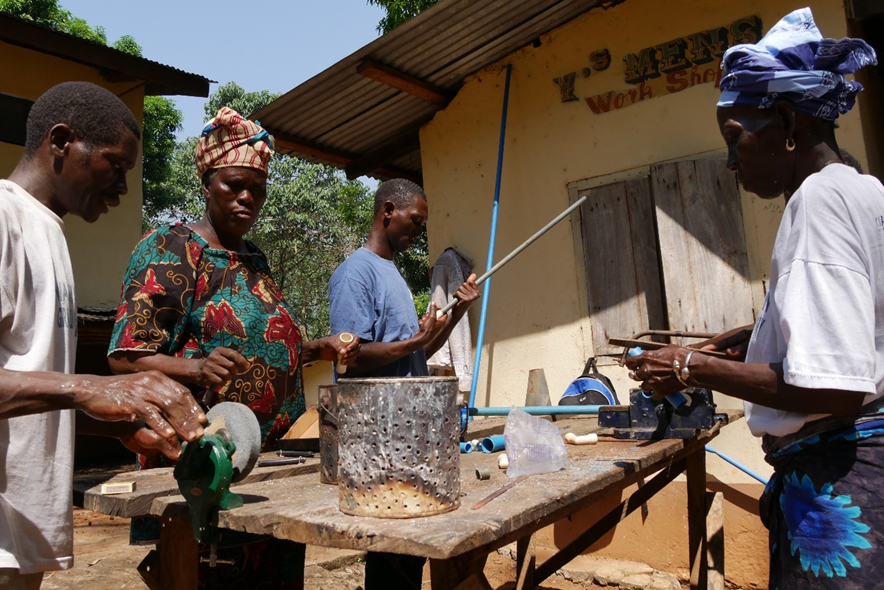
Curso de creación de bombas EMAS en Sierra Leona
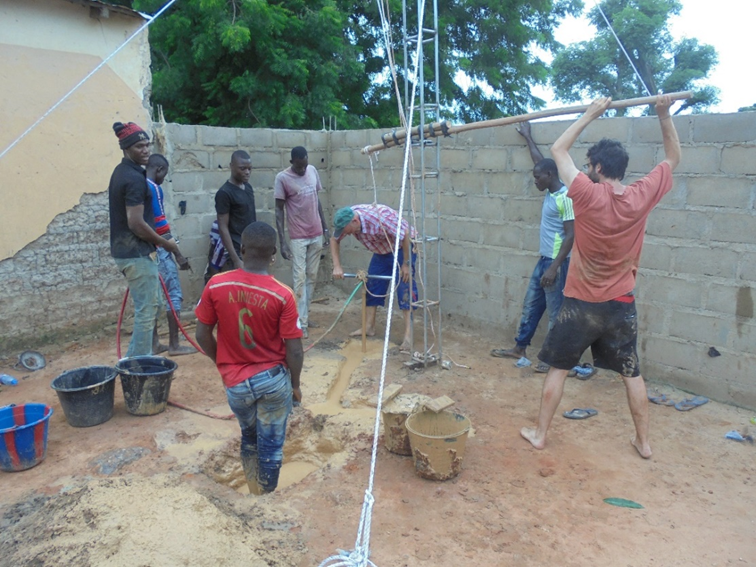
Perforación en Mali
Sistemas EMAS incluyendo captación de agua pluvial con cisterna enterrada, bomba manual, ducha, lavamanos y baño
Sobre el autor: Jaime Aguirre es originalmente un ingeniero mecánico que trabajo muchos años como ingeniero de diseño en el sector de la energía eólica. Después de algunas experiencias decepcionantes con la implementación de tecnologías WaSH de alta tecnología, se unió en 2014 voluntariamente a una formación EMAS en Bolivia. Desde entonces, se ha dedicado permanentemente a impartir formación junto con la ONG EMAS-International e.V. con sede en Alemania. En 2015 puso en marcha la ONG española TADEH en Bilbao, España, que ofrece formación en tecnologías de autoabastecimiento EMAS en todo el mundo.
¿Le ha gustado este blog? ¿Le gustaría compartir su perspectiva sobre el sector del agua rural o su historia como profesional del agua rural? Invitamos a todos los miembros de la RWSN a contribuir a esta serie de blogs del 30º aniversario. Los mejores blogs serán seleccionados para su publicación y traducción. Por favor, consulte las directrices del blog aquí y póngase en contacto con nosotros (ruralwater[at]skat.ch) para obtener más información.Si aprecia el trabajo de la RWSN y desea apoyarnos económicamente, puede hacerlo aquí.
This year we are celebrating 30 years since the Rural Water Supply Network was formally founded. From very technical beginnings as a group of (mostly male) experts – the Handpump Technology Network- we have evolved to be a diverse and vibrant network of over 13,000 people and 100 organisations working on a wide range of topics. Along the way, we have earned a reputation for impartiality, and become a global convener in the rural water sector.
RWSN would not be what it is today without the contributions and tireless efforts of many our members, organisations and people. As part of RWSN’s 30th anniversary celebration, we are running a blog series on rwsn.blog, inviting our friends and experts in the sector to share their thoughts and experiences in the rural water sector.
This is a guest blog by RWSN Member Jaime Aguirre, based in Bilbao, Spain.
EMAS is the Spanish acronym for “Escuela móvil del agua y saneamiento” meaning Mobile School of Water and Sanitation; the acronym was coined in the 1980´s in Bolivia by Wolfgang Buchner, supported by a group of volunteers.
The main mission of EMAS is to teach families how to obtain clean water by themselves. “Hand-on learning” is the most optimal way to learn these techniques.
The EMAS WaSH scheme include various Do-It-Yourself technologies like the EMAS manual pump, manual well drilling up to 90 metres, water storage tanks, and VIP toilets among others. All technologies have been in constant development since the 1990’s. They have been implemented in more than 25 countries, mostly in Latin America and Africa. The RWSN library hosts documentation and assessments of the use of EMAS technologies in Uganda, Sierra Leone, Panama and Bolivia amongst others.
The goal of EMAS technologies is to provide access to clean water and sanitation through training of local technicians and beneficiaries. These trainings are compact courses where over several weeks all techniques are demonstrated and practiced. In a long term, all facilities can be maintained by the user due to the technology’s simplicity. The result:
Improved access to clean drinking water for the world’s rural populations combined with simple sanitary facilities, thus preventing the spread of infectious diseases and reducing mortality rates.
Increased quality of life, e.g. by eliminating laborious water-hauling, thus saving women and children time and enabling small farming operations.
The trained well builders are self-sufficient and independent, and can, if necessary, receive repeated advising and training.
Sustainability: The wells and water facilities are very affordable. Experience has shown that the owners maintain the facilities quite well, which results in long service lives. Any repairs that may be needed are usually easy to complete.
All materials needed for these repairs can be obtained locally.
The materials and methods are environmentally responsible and most of the steps are performed manually.
The withdrawal of moderate amounts of water and its disciplined use have no negative impact on the environment or groundwater levels.
Improved opportunities for people to stay in their home regions permanently.
The EMAS hand pump is the key component of the EMAS-technologies because it is capable of pumping water vertically up to 50 m. While other hand pumps have higher resistance to intensive or even inappropriate use (many times when the pump is being used by a whole community), the EMAS pump is designed mainly for household use. EMAS pumps have a long service life since any repairs that may be needed are usually easy to complete by the user.
Video-instructions can be viewed on a YouTube channel which counts about 15.000 followers with some videos having over 700.000 views.
Sometimes adaptions of the technologies have to be made or are even necessary in some countries due to material availability.
As of now, approximately 70.000 EMAS wells have been drilled worldwide. The majority have been financed by the families or beneficiaries. Since the 1980’s, worldwide more than 100 trained technicians have created a micro enterprise offering WASH services to their community. EMAS technologies have been implemented in over 25 countries through cooperations with various local and international organizations (e.g. PAHO (Pan American Health Organization) ). As a result of the cooperation with Welthungerhilfe more than 3.000 EMAS wells have been drilled in Sierra Leone.
EMAS aims to partner with organizations which include WASH in their programmes and also wish to implement the mentioned technologies trough training projects in WASH. Projects should include follow-up and support to trained WASH technicians to help them in becoming SMEs. Many cases show that workers of SMEs create their own company and serve other regions which have high demand for WASH services.
An EMAS learning page will be launched shortly in order to share all experiences in various countries and also facilitate all available material. This webpage will also target users with technical skills who wish to learn more about the technologies.
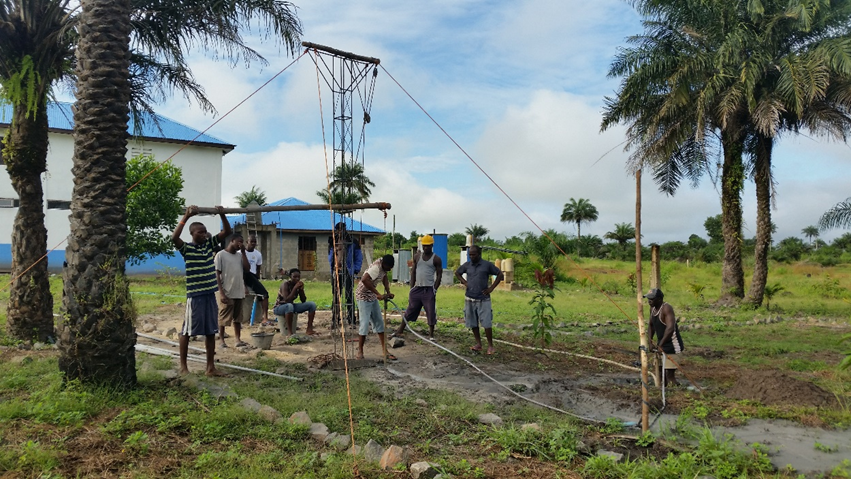
Drilling a well in Sierra Leona WASH Center
Amadou, EMAS technician from Senegal going with his drilling equipment to make a new well
Training of EMAS pump making at Sierra Leone
Drilling training at Mali
EMAS systems including rainharvesting, underground tank, bomba manual, toilet, shower and sink
About the Author: Jaime Aguirre is originally a mechanical engineer who acted many years as design engineer in the wind energy sector. After some disappointing experiences with the implementation of high-tech WaSH technologies he joined in 2014 voluntarily an EMAS training in Bolivia. Since then, he has permanently been engaged in providing training together with German based NGO EMAS-International e.V. In 2015 he initiated the Spanish NGO TADEH in Bilbao, Spain which provides training in EMAS Self Supply technologies worldwide.
Did you enjoy this blog? Would you like to share your perspective on the rural water sector or your story as a rural water professional? We are inviting all RWSN Members to contribute to this 30th anniversary blog series. The best blogs will be selected for publication. Please see the blog guidelines here and contact us (ruralwater[at]skat.ch) for more information. You are also welcome to support RWSN’s work through our online donation facility. Thank you for your support.
It is with a heavy heart that I wanted to report to this network the sad news I recently received about the recent passing of Erik Nissen-Petersen in Nairobi.
While I am not party to all the details, I understand he had been in hospital for some weeks following an incident in which he was attacked by a stranger with a stun-gun while he was riding a taxi. Nevertheless, it is his life’s work that I want to focus on in this short personal tribute and I invite others, particularly those who knew or worked with Erik in East Africa and beyond to add their own tributes.
This is a guest blog by Riley Mulhern, a PhD student at the University of North Carolina. If you are interested in issues related to water quality monitoring, you can join our online community here.
In areas of water scarcity around the globe, made worse by climate change and pollution of groundwater, rainwater harvesting remains an important source of water supply for rural communities.
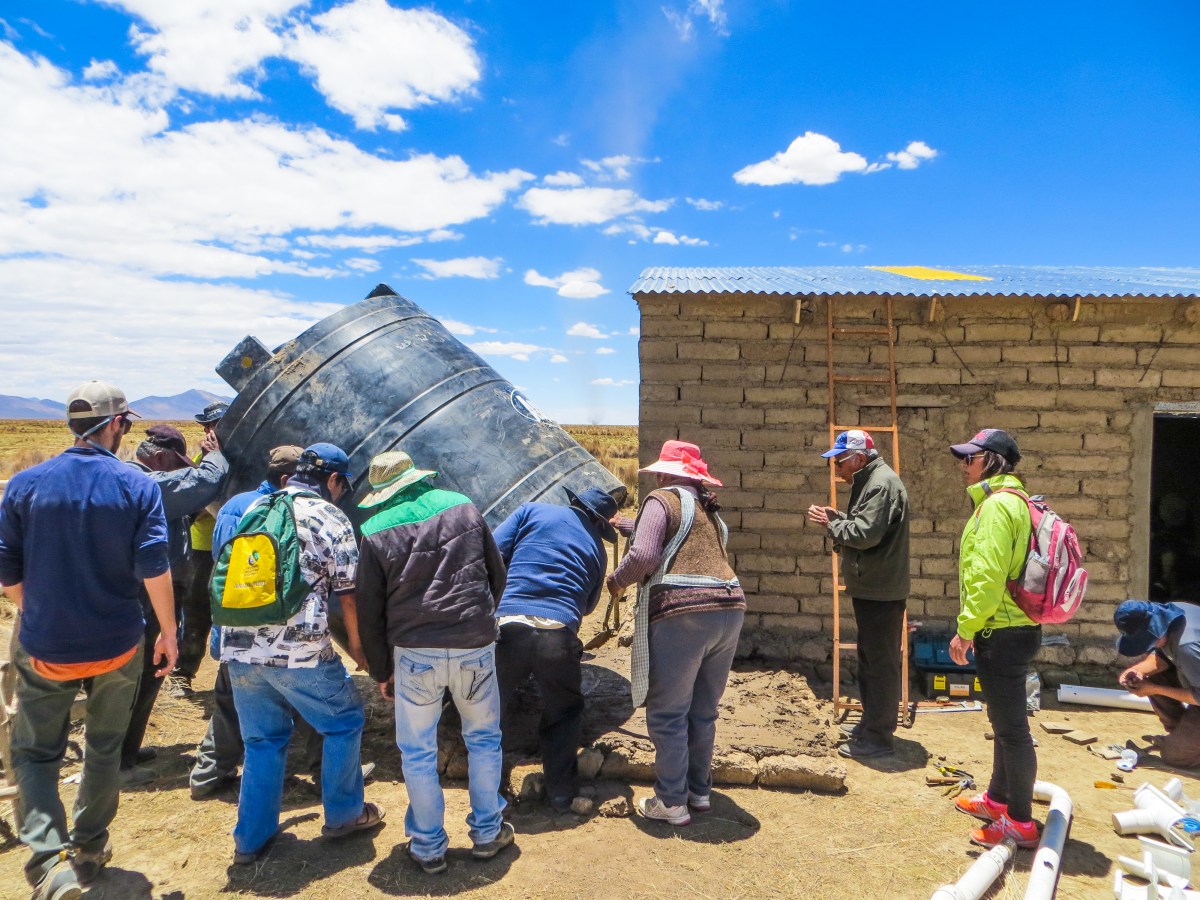
This is especially true in the Bolivian altiplano, where drought and mining work together to create pockets of severe water stress in what is generally considered a water-rich country. I lived among these communities high in the Andes for two years working with an organization called the Centro de Ecología y Pueblos Andinos(Center for Ecology and Andean Peoples, or CEPA). I assisted CEPA with a small-scale rainwater harvesting project for rural communities with high needs.
Over the course of the project, CEPA monitored the quality of harvested rainwater through consecutive wet and dry seasons. Surprisingly, we detected arsenic in every tank we monitored, 18 in total, whereas no microbial contamination was found.
This finding alerted CEPA to the risk of rainwater contamination in the region. Further testing identified roof dust that flushes into the tanks from the roof catchment as the principle source of arsenic in the rainwater. No arsenic was detected in raw rainwater before it interacted with the roof or tank. The source of the arsenic in the dust, whether naturally elevated in the altiplano soil or mobilized due to mining activity and released into the environment, is unknown, but widespread mining contamination in the area is likely a contributor.
Given these findings, the implementation of rainwater harvesting as an alternative drinking water supply by nonprofit groups and charitable organizations without adequate monitoring and evaluation of water quality is a potential concern. Since rainwater is presumed to be arsenic-free, rainwater harvesting has been promoted as an alternative drinking water source in other areas affected by arsenic contamination of groundwater as well, such as Mexico, parts of Central America, and Bangladesh. It is not safe to assume rainwater will be entirely arsenic-free, however. The levels found in collection tanks in Bolivia were double the WHO health guideline of 10 parts per billion.
As a result, arsenic and other metals should be included as standard monitoring parameters in rainwater projects. Groups implementing rainwater harvesting projects should seek additional partners with the tools and knowledge to perform thorough water quality testing.
This can be accomplished either through basic field tests, which provide semi-quantitative information for initial screening, or through laboratory analysis. Research done at North Carolina State University found that the standard field method—where inorganic arsenic in a water sample is reduced to arsine gas, which then reacts with a mercuric bromide strip to turn color—tends to underestimate the actual arsenic concentration as verified by ICP-MS (a sophisticated method that detects counts of atoms in a sample at specific molecular weights, allowing for a precise quantitative measurement). However, these low-cost and easily transportable kits still offer an accessible and simple screening tool for the presence of arsenic. The ITS Econoquick, for example, provides 300 tests with a 0.3 ppb detection limit for less than $200. For more precise measurements and longer term use, the Palintest Arsenator includes a standardized digital reading of the colorimetric output for $1,200. Both kits were field tested by CEPA and were easy to use for untrained operators.
In addition to greater testing, practitioners should also consider the required first flush volume for their project. First flush systems are essential for any rainwater harvesting scenario to mitigate both microbial and chemical risks. This is especially true when used as a drinking water source. One rule of thumb is that first flush systems should be able to capture at least 4 liters of water for every 10 square meters of roof. The tanks monitored in Bolivia did not meet this standard. Thus, the risk of arsenic contamination of rainwater and simple controls for system design and monitoring should also be communicated widely through knowledge platforms such as RWSN and the RAIN Foundation.
The results of this monitoring study were compiled by CEPA and a Belgian organization, the Comité Académico Técnico de Asesoramiento a Problemas Ambientales (CATAPA). The full results have been published and are accessible through the journal Science of the Total Environment. This work has also been featured previously by EngineeringforChange.org.
About the author
Riley Mulhern is a PhD student at the University of North Carolina Chapel Hill Gillings School of Global Public Health. He worked previously as a technical water quality adviser for a Bolivian environmental justice nonprofit addressing issues of mining contamination in rural indigenous communities in Oruro, Bolivia. He is from Denver, Colorado and received his B.S. in physics and geology from Wheaton College in Wheaton, IL and M.S. in Environmental Engineering from the University of Colorado Boulder. He has worked previously on water projects in Nicaragua and Haiti.
Photo: Rainwater tank monitored for the study being installed. Photo credit: Maggie Mulhern.
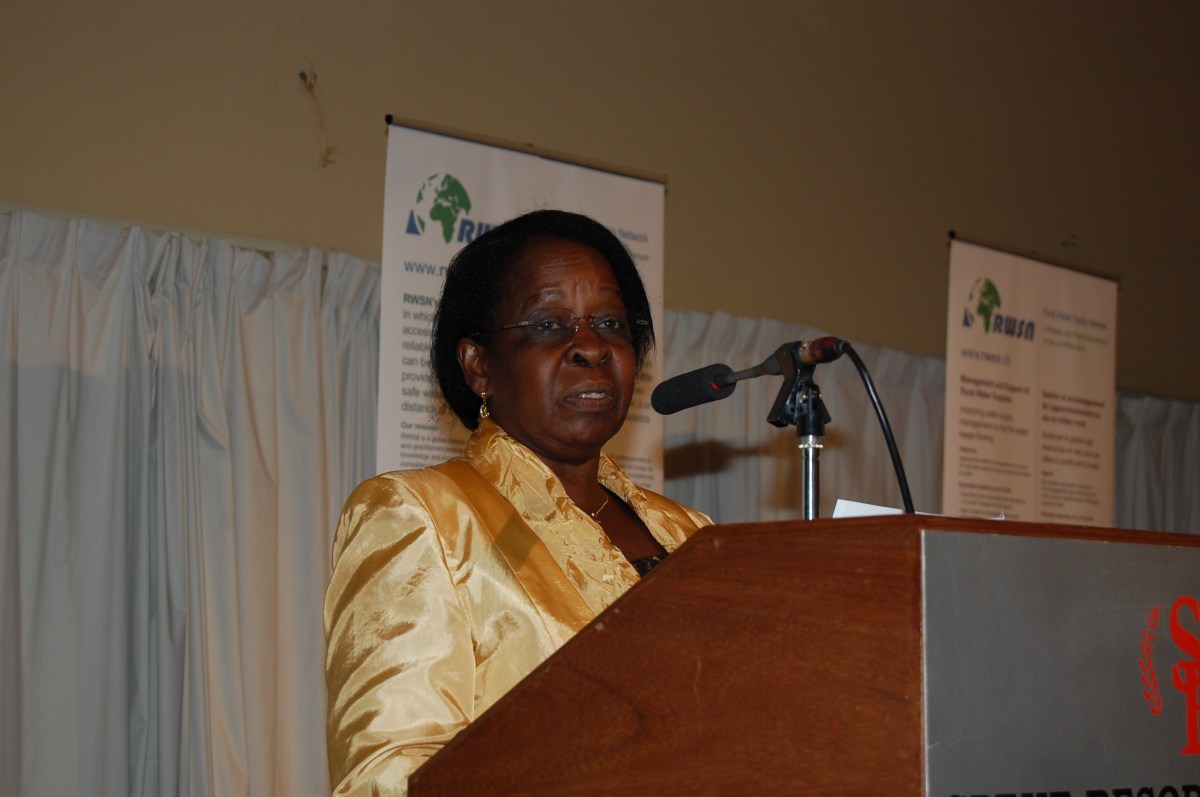
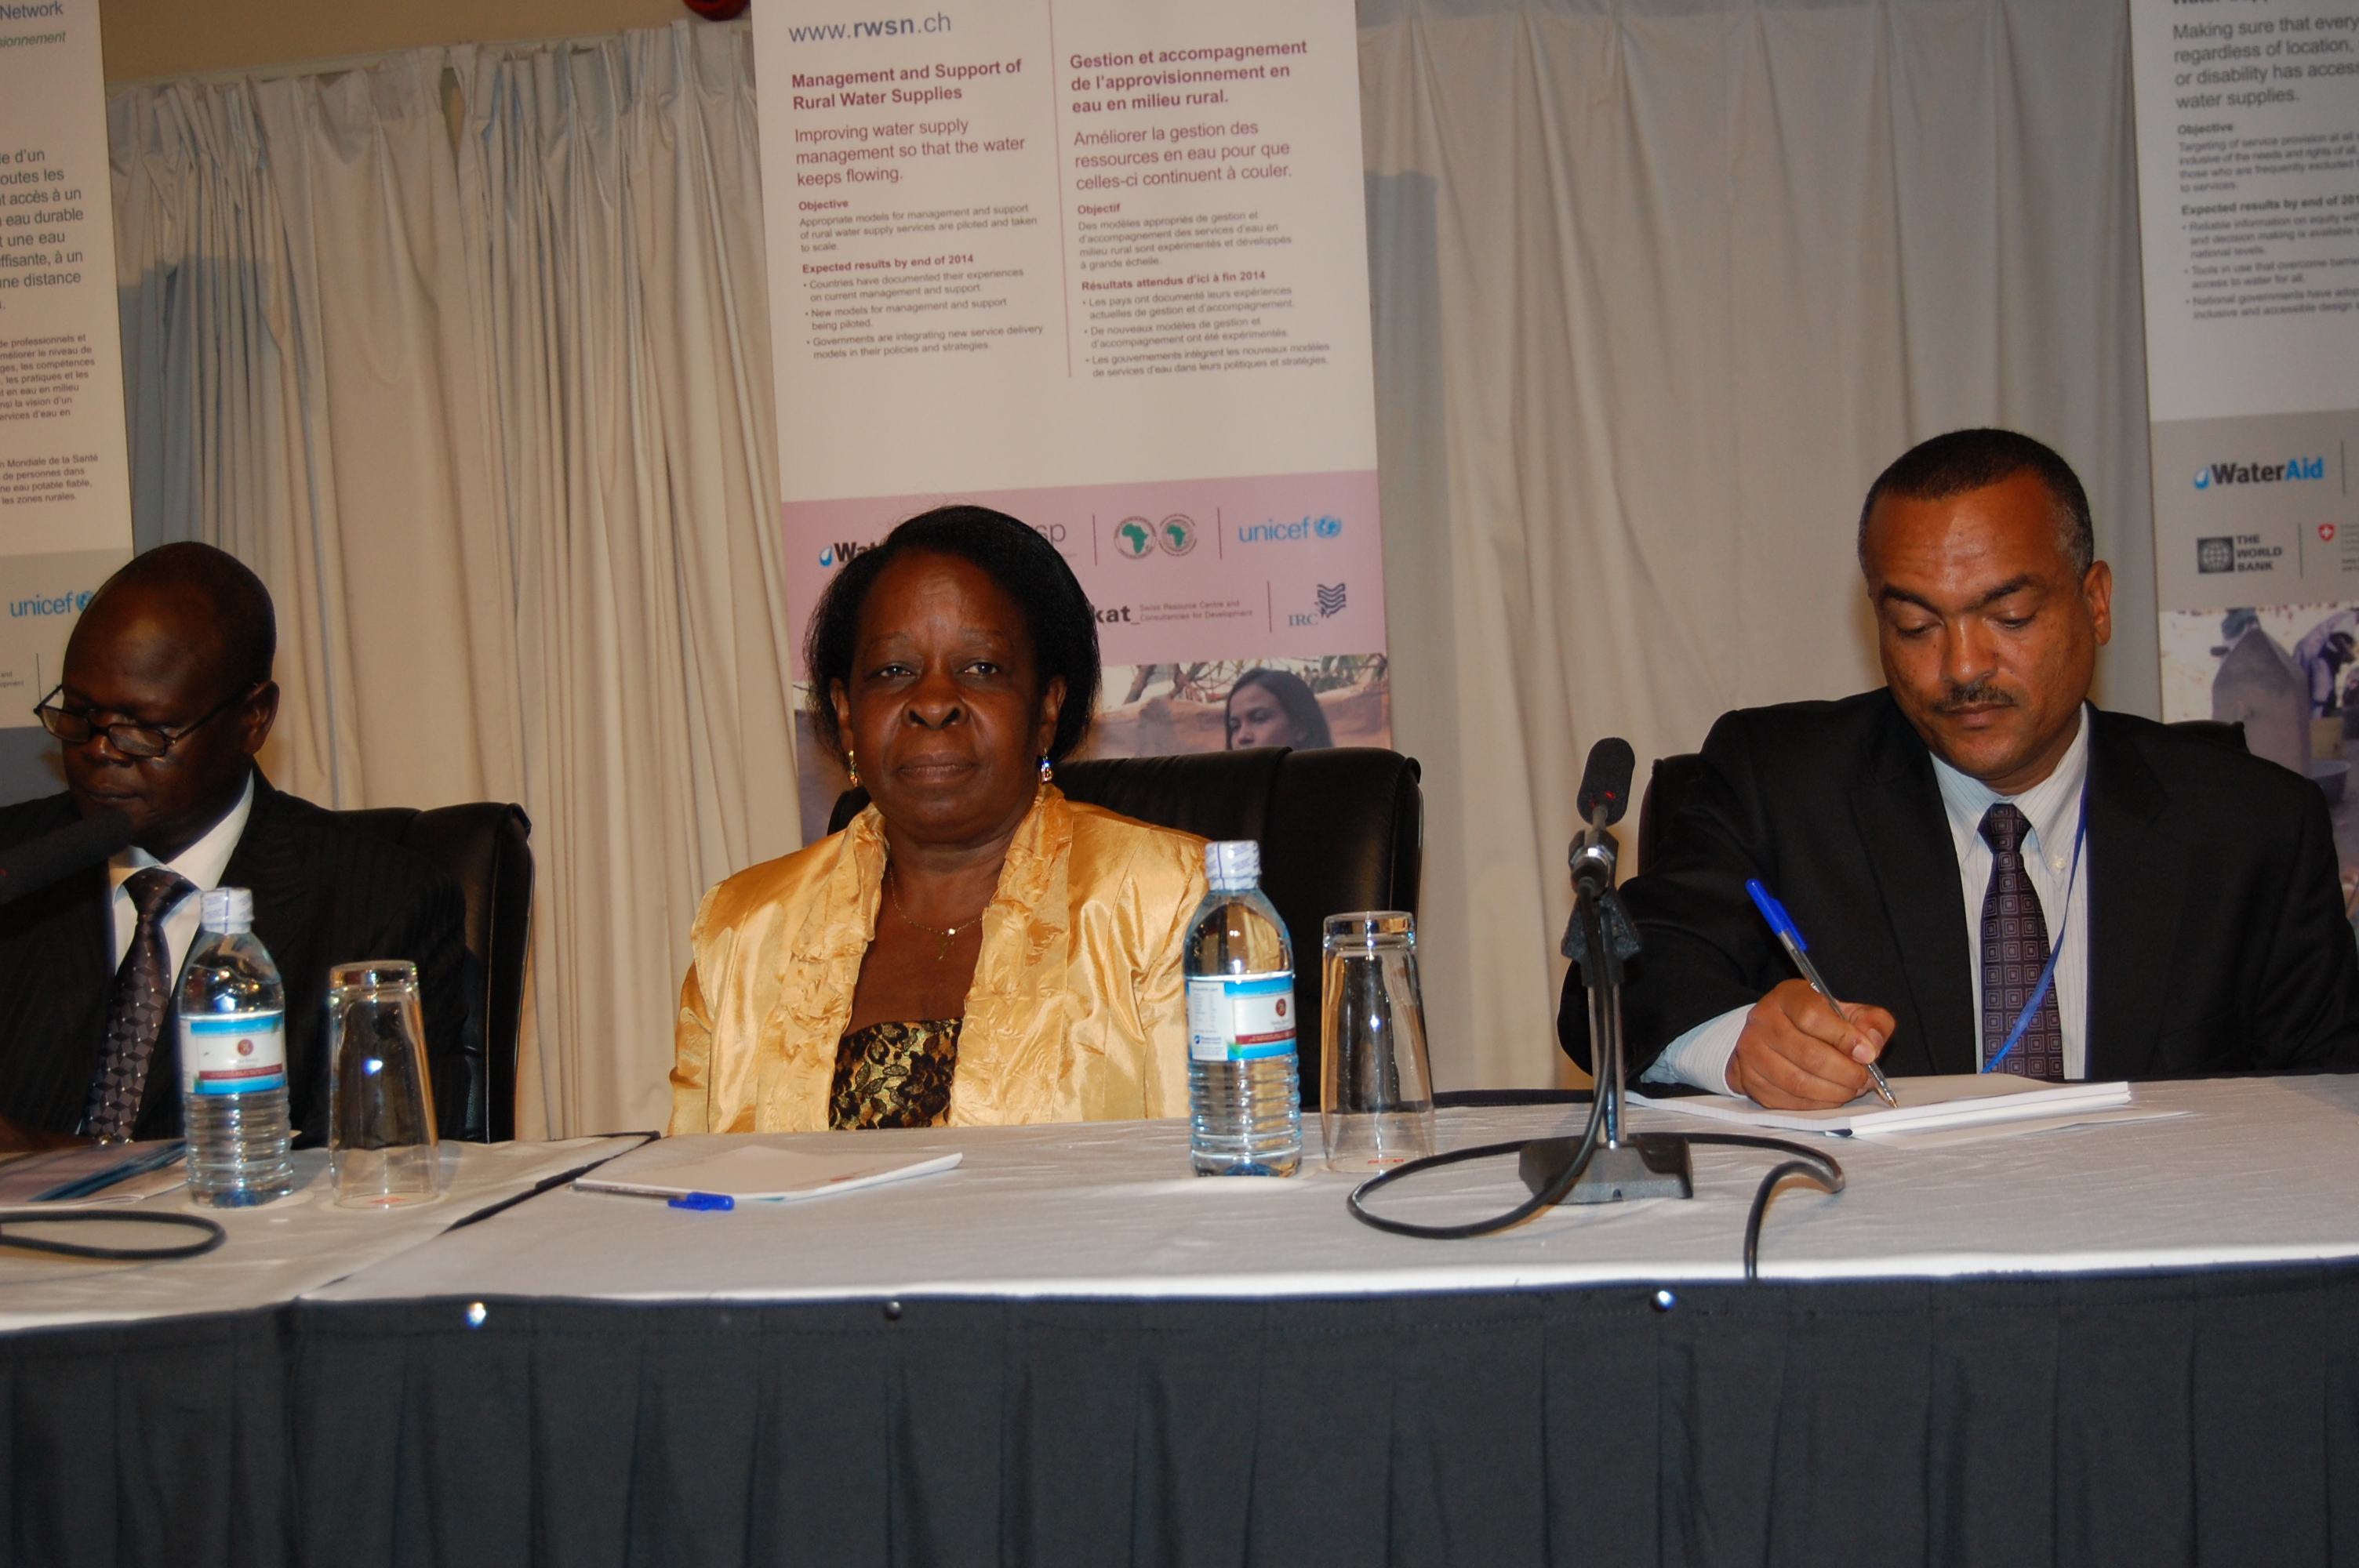
It is with great sadness that we have heard of the passing of the Honorable Maria Mutagamba, former Minister for Water & Environment, Uganda.
by Sean Furey, RWSN Secretariat
It is with great sadness that we have heard of the passing of the Honorable Maria Mutagamba on 24 June, at the age of 64. Mrs Mutagamba was an economist and politician, who according to Wikipedia:
She served in various posts in the Government of Uganda, most recently as Minister for Tourism. However, she is best known to RWSN members as the State Minister for Water Resources, from 2000, and then Minister for Water and Environment between 2004 and 2012. During this period she served as President, African ministers’ council on water (AMCOW), (2004–2012).
Under her leadership, the Ministry of Water & Environment became internationally recognised as leading actor in African water management issues, with a capable civil service team and an open attitude to innovation and collaboration with international partners. Annual processes of Joint Sector Reviews and Sector Performance reporting became the gold standard of improving coordination, reporting and accountability across the WASH and water resources sectors.
I had the pleasure of meeting her when she came to open the 6th RWSN Forum in 2011 – of which she was a great supporter – and then again at the 6th World Water Forum in Marseille. I was struck by how humble and thoughtful she was, yet also strong and with a keen intellect. She had a particular passion for rainwater harvesting, which she saw as an opportunity that was being missed.
According to the New Vision and other news sources, she had been suffering poor health for some time and died of liver cancer. Uganda has sadly lost a great water champion.


 She served in various posts in the Government of Uganda, most recently as