If you measure something, how do you know that someone else would get the same result? This is a fundamental question in many fields including medicine and psychology, but it is rarely considered in rural water supply.
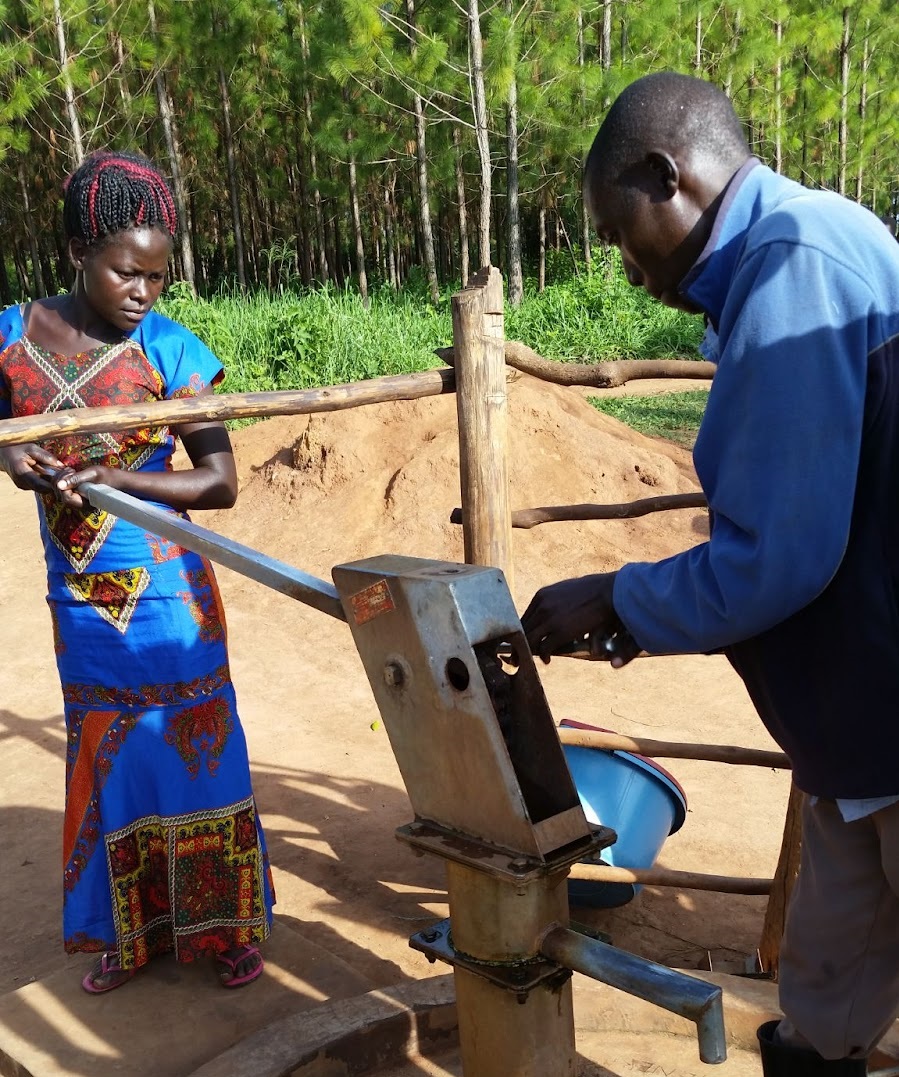
Photo: A handpump mechanic performs preventive maintenance in Uganda (Photo: Daniel W. Smith)
If you measure something, how do you know that someone else would get the same result? This is a fundamental question in many fields including medicine and psychology, but it is rarely considered in rural water supply.
This problem became painfully apparent during a recent study of professionalizing handpump maintenance in Uganda conducted by the Program for Water, Health, and Development at the Stanford Woods Institute for the Environment and International Lifeline Fund. Our data collection team had a seemingly straightforward instruction: Count a handpump as functional if it provides water. But different data collectors interpreted the instruction differently. Some would count a handpump as functional even if it took a long time to get a little water. Others counted handpumps in a similar condition as nonfunctional. We needed a clearer, more reliable procedure to ensure that handpump functionality measured by different people would be comparable.
This year we are celebrating 30 years since the Rural Water Supply Network was formally founded. From very technical beginnings as a group of (mostly male) experts – the Handpump Technology Network – we have evolved to be a diverse and vibrant network of over 13,000 people and 100 organisations working on a wide range of topics. Along the way, we have earned a reputation for impartiality, and become a global convener in the rural water sector.
RWSN would not be what it is today without the contributions and tireless efforts of many our members, organisations and people. As part of RWSN’s 30th anniversary celebration, we are running a blog series on rwsn.blog, inviting our friends and experts in the sector to share their thoughts and experiences in the rural water sector.
This is a blog post from RWSN Member Hannah Ritchie, based in the United Kingdom
—
In 2020, I joined forces with Sand Dams Worldwide (SDW) to help them answer the question of “how long water from sand dams is lasting throughout the year”. In this short blog post, I am happy to discuss with you our findings and the implications of this study. We’ll be discussing “why we are interested in this question”, “how we researched this question”, and “what we found out”.
Firstly though, for those of you not familiar with what a sand dam is, I would like to direct you here for a video, which explains them better than I could, and here to SDW’s website where you can find everything sand dam related you might need to know.
Why are we interested (and why you should be too)?
So, why do we care about whether sand dams are providing water year-round? There is uncertainty over whether water from sand dams is lasting all the way through the dry season, or whether people can only abstract water from sand dams at the beginning of the dry season, when they have just been replenished by the rains. Because of this conflict in results, we can’t easily conclude how effective sand dams are as a dryland and specifically dry season water source. For example, can people rely on them when other water sources are unavailable (such as when surface waters have run dry)? Or are the dams dry by the second week of the dry season? Answering this question is very important for understanding their level of use, acceptance, and financial viability, helping to inform future water management interventions and to ensure that communities are serviced with a continuous improved supply. Knowing whether there are certain dry season months when sand dams have no water being abstracted can also inform on months when water supply from other sources needs expanding. Finally, knowing which sand dams have more or less water being abstracted can aid in optimising sand dam design.
You might be thinking, “but no water abstracted doesn’t necessarily mean no water being available”, and you would be right. Because, whilst abstraction volumes may be linked to storage, many other variables, such as convenience, quality, and the use of other sources can also impact abstraction. Thus, the contribution that sand dams make to water security is not synonymous with the amount of water actually stored in the dam. Therefore, whilst this study can show us abstraction patterns from sand dams and therefore behaviours of use, it cannot confirm for certain whether there is or isn’t any water available.
How did we do it?
Now you know why we’re interested and why it matters, how did we actually go about answering the question: “how long water from sand dams is lasting throughout the year”? In 2019, 26 sand dam hand pumps in Makueni and Machakos Counties, Kenya were fitted with Waterpoint Data Transmitters (WDT) by ASDF. These devices measure the number of times and with what force a handpump is used over an hour and convert this into an estimated volume of water abstracted (Thomson et al., 2012). This data point is then transmitted by SMS. I had access to this remotely sensed data from April 2019 until October 2021. With a data point every hour for 26 sites over 31 months, I ended up with a very large data set!
Alongside this abstraction data, I also had access to interview and observation data provided by MSc student Joanna Chan, ASDF, and SDW. These variables included perceived salinity, abstraction limits, livestock use, whether the dam is said to have ever run dry, presence of rainwater harvesting tanks, actual salinity (μs/cm), area of dam wall (m2), average distance travelled from home to dam (km), and user numbers (Chan, 2019).
This data was then analysed to assess how much water people were abstracting and for how long throughout the year the water continued to be abstracted for. The variables collected from interview and observation were then analysed to provide insight into differences in abstraction between sites. For example, did sites with larger dam walls have more water being abstracted, or did salinity impact abstraction in any way?
Finally, we looked specifically at the last week in September (as a proxy for the end of the long dry season) to assess whether enough water to specifically meet drinking water needs (2 L/p/day) was still being abstracted at any sites. Due to the necessity of an improved source of water for drinking (of which a handpump is one), we wanted to know whether the handpumps could independently meet drinking water needs, in case no other water sources were available.
What did we find out?
After analysing all of the data and wrapping my head around some statistical analysis, I like to think that we found some interesting results.
The most obvious finding was that of high variability in abstraction volume between the 26 hand pumps and seasons. We found abstraction to be significantly higher in the long dry season, indicating a high reliance and delivery of water when other sources are compromised. The diagram below shows median monthly abstraction (L/month) (red line) and average monthly rainfall (mm) (brown bars – dry season and blue bars rainy season) across all sites – indicating higher abstraction when rainfall is lower.
There was abstraction data available from 21 handpumps (81%) by the end of at least one of the analysed long dry seasons, with at least some water still being abstracted. At 59.1% of these sites, enough water to meet each user’s drinking water needs (2 L/p/day) was being abstracted in at least one of the analysed years. This indicates that such dams can meet the drinking water needs of users independently of other sources.
Using the variables which were collected in interviews and observations, we found that sites with a greater proportion of people using the water for livestock, higher salinity, and larger dam walls had significantly higher levels of abstraction. This is to be expected as higher salinity sites are often used more for livestock (Chan, 2019), which have a greater water demand than that for drinking, whilst larger dam walls can lead to a greater volume of sand build up and therefore water storage (Maddrell & Neal, 2012).
These results highlight sand dams as a sustainable alternative to other dry season sources such as water vendors, which can be expensive and unreliable. However, lower abstraction in certain months and sites highlights that we must approach water management holistically. No one technique is necessarily the answer to dryland water security and all available water sources must be considered. Clearly, not all sand dams behave the same, with certain sand dams always likely to have higher levels of abstraction than others. However, high abstraction and sustained water availability by the end of the long dry season at many sites profess the positive contribution that sand dams can make to a community’s water supply, offering opportunities for further success in the future.
Closing remarks
I really hope you enjoyed learning about abstraction trends from sand dams as much as I enjoyed studying them (most of the time!) If you’re interested in learning more, I hope the paper will be published soon, which will be freely available for everyone to read. If you’d like to reach out, my email is hannah.ritchie@cranfield.ac.uk. Many thanks for reading.
A bit about the author
I am a PhD student at Cranfield University. I began my PhD in September 2019 in WaSH with the CDT Water WISER. With a background in geology and environmental engineering, I wanted to design my PhD project around earth sciences and development. This was how I ended up finding sand dams and partnering with SDW and Africa Sand Dam Foundation (ASDF).
Outside of work I love to run, hike (generally be outdoors as much as possible), read, and am learning French. I am very passionate about science communication and firmly believe that research results need to be translated into accessible formats for all to read and understand, hence why I have written this blog post for you (definitely shorter, more fun, and less boring than reading a 15-page paper!)
Did you enjoy this blog? Would you like to share your perspective on the rural water sector or your story as a rural water professional? We are inviting all RWSN Members to contribute to this 30th anniversary blog series. The best blogs will be selected for publication. Please see the blog guidelines here and contact us (ruralwater[at]skat.ch) for more information. You are also welcome to support RWSN’s work through our online donation facility. Thank you for your support.
Photo credits: Hannah Ritchie
References
Chan, J. (2019). Abstraction of Water from Sand Dams in Machakos and Makueni Counties (Kenya) via Handpumps.
Maddrell, S., & Neal, I. (2012). Sand Dams: a Practical Guide.
Thomson, P., Hope, R., & Foster, T. (2012). GSM-enabled remote monitoring of rural handpumps: A proof-of-concept study. Journal of Hydroinformatics, 14(4), 829–839. https://doi.org/10.2166/hydro.2012.183
Guest blog by Leslie Morris-Iverson and St. John Day
The protracted Covid-19 pandemic has restricted international travel, cancelled or shifted international conferences on-line and confined many of us to working from home. These changes, along with an awareness of growing and intersecting threats to water supply means it is increasingly important to hear the voices and learn from the experiences of practitioners who continue to work on the frontline. We have edited a book “Resilience of Water Supply in Practice: Experiences from the Frontline” (published at the end of 2021) to help us listen to those voices, people working for utilities, contractors, catchment organizations, or non-governmental authorities, on how they are implementing to address these increasingly complex resilience challenges.
Many service providers are striving to improve the resilience of their water supply services in some very challenging environments. This refers to improving or maintaining service levels, so they can resist, recover from and withstand multiple growing pressures and shocks, such as increased water demands, aged and crumbling infrastructure, environmental pressures (including climate change) and natural or human-made disasters.
In the book, we highlight there needs to be renewed focus on strengthening resilience to raise service levels and improve professional standards of service. If service levels decline or systems breakdown there will be little prospect of getting at least basic services to people, let alone the more ambitious target of safe, adequate and affordable water supply services for all.
To improve resilience, service providers need to imagine what a resilient water supply service will look like. They should conceptualise the key factors that underpin resilience and introduce approaches that will strengthen each component. They also need to ensure inter-linkages between these component parts. This requires detailed analysis of water resources, high quality infrastructure – fit for the local context, strong management arrangements and an adaptive or iterative approach so that learning, adjustments and improvements are continuous. This means decision-makers and service providers should be concerned with wider systems strengthening work, but at the same time they must also identify immediate actions and areas where they can achieve maximum impact. This is often referred to as ‘doing the right thing and doing it right’.
In the book we present several case studies from different contexts. It consists of eight different examples, contributed by different authors, all of whom are highly experienced in water supply service provision. Each case study brings a different context, challenge, experiences and some practical findings and conclusions. Examples range from: managing water demand in the United Kingdom, to the Cape Town water crisis, to rebuilding water supply services in Freetown; from the challenges of rural water supply in Eastern Sudan, Tajikistan and Iraq, to improving service levels in post emergency situations.
This network is devoted to the important issue of rural water supply. Over the past decade or so, there have been numerous studies highlighting underperformance and shortcomings in community-based maintenance approaches. In this book many of the challenges faced by utilities are highlighted, and, in our opinion, much work is required to improve service levels and increase customer satisfaction. One of the main challenges, as demonstrated in the Sierra Leone case study, is how to strengthen resilience in a systematic manner, when development projects are short term, projects are pre-conceived and often fail to address the most critical problems the utility is facing.
One of the main conclusions from the book is that resilience is being improved through an iterative and adaptive approach. Frontline operators often need to start by ‘doing what they can with what they have,’ while setting realistic and achievable targets. There must be a strong focus on ensuring interventions are relevant to the local context and implemented professionally to prevent reworking and excessive costs. In editing the book, the importance listening to service providers who really are on the frontline – has become ever apparent.
We would like to thank everyone who contributed to this book being published and for assisting in making the book open access.
by Rossa O’Keeffe-O’Donovan, Economics PhD Candidate, University of Pennsylvania.
Which factors predict the functionality of hand pumps? Do communities free ride on their neighbors’ water sources? Are there positive spillover effects in the maintenance of nearby pumps? And what does this all mean for practitioners? This post gives an overview of my ongoing Economics PhD research, which tries to answer these questions.
Note: this research is still in progress, and I am seeking survey responses to complement my quantitative work, and help understand and interpret my results. If you have knowledge of how decisions are made in the installation and/or maintenance of hand pumps, please take this 8 minute survey here: bit.ly/PumpSurvey
Over the past decade, a dramatic shift has taken place in the water sector that fundamentally changes the way that work is done. During this time, water point mapping around the world has accelerated at unprecedented rates. Dropping costs of technology and innovative software has enabled national governments, as well as funders, NGOs, academics, and others to inventory, share, and even monitor the work they have contributed to.
There is a lot of attention for monitoring, and rightfully so. New Information and Communication Technologies (ICT) have opened great possibilities to collect data, store data and visualise data on mobile phones. Maybe some of you already have used mobile phones for data collection. New ICT has brought national scale sector monitoring within reach. It has been done in Liberia, countries in Central America, Ghana, Nigeria, Mali, Ethiopia and many others.
On behalf of the Water Point Data Exchange, we invite you to join a one hour webinar on Thursday, February 5 at 11:00am EST. This webinar will provide an exciting update on sector-wide efforts to support the sharing of water point data across diverse stakeholders.
This webinar will provide an exciting update on sector-wide efforts to support the sharing of water point data across diverse stakeholders. Harmonizing this data has the potential to provide unprecedented opportunities for learning from the past and managing water services well into the future.
Starting with a background on the objectives of this initiative, the webinar will also provide an update on the progress made to date and the next steps in the development of the Water Point Data Exchange. Participants will be introduced to the current draft standard and also learn how they can to help shape the standard as this work moves forward.
A few weeks ago, an interesting email discussion was held on “water point mapping” D-Group of the Rural Water Supply Network (RWSN). Part of the discussion focused on how much it costs to map or monitor all water systems in a country. Various figures were floating around in the discussion. But when looking at these in more detail, it was like comparing apples to oranges. Some of the costs mentioned had included the staff time of (local) government, others hadn’t, as they considered this to be a fixed cost; some referred only to a simple mapping of water points, others had done a more comprehensive collection of all kinds of data of the water points; some of the data were expressed in dollars per water point, others in local currency per person. So, no immediate sense could be made of the numbers. A former colleague once said: “an apple is…