
Preliminary analysis of census and national survey data from the 2019 Joint Monitoring Programme, by Dr Kerstin Danert
An important issue for those of us that think a lot about groundwater is the extent that various countries rely on it for their drinking water.
The data presented in the table below has been prepared from the 2019 data published by the Joint Monitoring Programme (JMP) of the World Health Organisation (WHO) and UNICEF (see https://washdata.org/data). Each country has an associated Country File (an excel spreadsheet) with collated data on Water, Sanitation and Hygiene use. This data is gathered from national censuses as well as household surveys such as the Demographic and Health Surveys (DHS) and Multiple Indicator Cluster Surveys (MICS) and many others. The country files given excel spreadsheets on the JMP website (not to mention the underlying surveys) contain a wealth of data!
The table below shows the percentage of the population that rely on groundwater point sources as their main source of drinking water for every country and territory for the most recent year for which census or survey data is available. The data is presented for urban, rural and total populations. Groundwater point sources include protected and unprotected wells and springs, as well as tube wells and boreholes. Countries may have slightly different nomenclature for the above terms, but these are harmonised in the country tables produced by the JMP.
It is important to note that the data only includes point sources. Water that is bought from vendors, sold in bottles/sachets or transmitted in pipes may also originate from groundwater, but this information is not generally collated by the censuses or surveys and thus cannot be reflected. Consequently, the actual dependency of a particular on groundwater for drinking may be considerably higher. In addition, national governments may also make calculations based on the infrastructure available and assumed number of users per source. Due to the different methods of data collection and calculation, these estimates may differ from that collected by the household survey or census.
Please note that the analysis below has not been peer-reviewed, and so if you are intending to use the data, please do check in the respective JMP country file. You can access Country Files on: https://washdata.org/data. Click on map to select country, download “Country file” and open the “Water Data” tab. In case you spot any mistakes in the table below, please respond in the comments in the blog below or contact the author directly, via rwsn@skat.ch.
Table 1 Groundwater point source as main drinking water source (% of the population classified as urban, rural and total)
| Urban | Rural | Total | ||||
| Country | Census/ Survey Year | Ground-water point source as main drinking water source (% of the urban pop.) | Census/ Survey Year | Ground-water point source as main drinking water source (% of the rural pop.) | Census/ Survey Year | Ground-water point source as main drinking water source (% of the total pop.) |
| Afghanistan | 2017 | 57.3% | 2017 | 71.5% | 2017 | 68.1% |
| Albania | 2012 | 6.4% | 2012 | 14.7% | 2012 | 10.2% |
| Algeria | 2013 | 6.6% | 2013 | 19.6% | 2013 | 11.3% |
| American Samoa | 2010 | 0.5% | ||||
| Andorra | 2005 | 6.6% | ||||
| Angola | 2016 | 17.7% | 2016 | 43.0% | 2016 | 26.8% |
| Anguilla | 2009 | 0.7% | 2009 | 0.7% | ||
| Antigua and Barbuda | 2011 | 0.4% | ||||
| Argentina | 2013 | 9.1% | 2010 | 37.7% | 2010 | 15.0% |
| Armenia | 2016 | 0.1% | 2016 | 2.6% | 2016 | 1.1% |
| Aruba | 2010 | 1.3% | ||||
| Australia | 2013 | 0.1% | 2013 | 1.1% | 2013 | 0.5% |
| Azerbaijan | 2017 | 0.1% | 2017 | 12.1% | 2017 | 5.4% |
| Bahamas | 2010 | 2.9% | ||||
| Bahrain | 1995 | 1.4% | ||||
| Bangladesh | 2016 | 66.4% | 2016 | 94.7% | 2016 | 84.9% |
| Barbados | 2010 | 0.1% | 2012 | 0.1% | ||
| Belarus | 2012 | 2.7% | 2012 | 32.9% | 2012 | 11.1% |
| Belize | 2016 | 0.3% | 2016 | 4.1% | 2016 | 2.5% |
| Benin | 2014 | 39.4% | 2014 | 56.8% | 2014 | 48.9% |
| Bhutan | 2017 | 0.3% | 2017 | 0.6% | 2017 | 0.5% |
| Bolivia (Plurinational State of) | 2017 | 5.0% | 2017 | 42.2% | 2017 | 16.5% |
| Bosnia and Herzegovina | 2012 | 3.6% | 2012 | 11.4% | 2012 | 8.9% |
| Botswana | 2017 | 0.1% | 2017 | 14.9% | 2017 | 5.3% |
| Brazil | 2017 | 0.4% | 2017 | 8.4% | 2017 | 1.6% |
| British Virgin Islands | 2010 | 1.9% | ||||
| Brunei Darussalam | 2011 | 0.1% | 2011 | 0.1% | 2011 | 0.1% |
| Bulgaria | 2001 | 0.4% | 2001 | 2.7% | 2001 | 1.1% |
| Burkina Faso | 2017 | 17.1% | 2017 | 85.6% | 2017 | 72.9% |
| Burundi | 2017 | 8.6% | 2017 | 68.1% | 2017 | 61.5% |
| Cabo Verde | 2007 | 0.1% | 2012 | 15.1% | 2012 | 5.1% |
| Cambodia | 2016 | 13.5% | 2016 | 47.2% | 2016 | 40.2% |
| Cameroon | 2014 | 35.5% | 2014 | 74.1% | 2017 | 50.0% |
| Canada | 2011 | 0.1% | 2011 | 0.7% | 2011 | 0.3% |
| Caribbean Netherlands | 2001 | 27.3% | ||||
| Cayman Islands | 2010 | 4.9% | 0.0% | 2010 | 4.9% | |
| Central African Republic | 2010 | 49.1% | 2010 | 92.1% | 2010 | 75.4% |
| Chad | 2015 | 48.0% | 2015 | 82.4% | 2015 | 74.6% |
| Chile | 2017 | 0.6% | 2017 | 4.0% | 2017 | 2.4% |
| China | 2013 | 7.4% | 2013 | 43.1% | 2016 | 22.4% |
| Colombia | 2018 | 0.4% | 2018 | 13.7% | 2018 | 3.3% |
| Comoros | 2012 | 5.1% | 2012 | 21.3% | 2012 | 16.2% |
| Congo | 2015 | 24.9% | 2015 | 65.7% | 2015 | 38.3% |
| Cook Islands | 2011 | 0.0% | ||||
| Costa Rica | 2018 | 0.0% | 2018 | 0.5% | 2018 | 0.2% |
| Côte d’Ivoire | 2017 | 33.9% | 2017 | 71.0% | 2017 | 49.5% |
| Croatia | 2003 | 3.3% | 2003 | 18.0% | 2003 | 20.0% |
| Cuba | 2011 | 13.5% | 2014 | 41.9% | 2011 | 18.2% |
| Curaçao | 2011 | 0.9% | ||||
| Czechia | 2003 | 1.5% | 2003 | 7.1% | ||
| Democratic People’s Republic of Korea | 2017 | 17.1% | 2017 | 58.1% | 2017 | 33.1% |
| Democratic Republic of the Congo | 2014 | 33.0% | 2014 | 79.4% | 2014 | 63.5% |
| Djibouti | 2017 | 0.6% | 2017 | 55.5% | 2017 | 10.9% |
| Dominica | 2001 | 0.6% | 2001 | 6.3% | 2009 | 0.3% |
| Dominican Republic | 2016 | 0.1% | 2016 | 2.3% | 2016 | 0.7% |
| Ecuador | 2017 | 1.1% | 2017 | 17.1% | 2017 | 6.1% |
| Egypt | 2017 | 0.4% | 2017 | 2.1% | 2017 | 1.4% |
| El Salvador | 2017 | 3.0% | 2017 | 12.3% | 2017 | 6.6% |
| Equatorial Guinea | 2011 | 44.7% | 2011 | 51.9% | 2011 | 48.4% |
| Eritrea | 2010 | 3.4% | 2010 | 36.0% | 2010 | 24.6% |
| Estonia | 2010 | 1.7% | 2010 | 18.8% | 2010 | 6.7% |
| Eswatini | 2014 | 3.7% | 2014 | 31.5% | 2014 | 24.0% |
| Ethiopia | 2017 | 5.1% | 2017 | 62.3% | 2017 | 52.0% |
| Falkland Islands (Malvinas) | 2016 | 43.7% | ||||
| Fiji | 2014 | 1.1% | 2014 | 13.6% | 2014 | 7.2% |
| Finland | 1999 | 1.0% | 2005 | 5.0% | 2005 | 1.0% |
| French Guiana | 1999 | 5.0% | 1999 | 6.0% | 2015 | 13.5% |
| Gabon | 2013 | 3.3% | 2013 | 37.8% | 2013 | 8.2% |
| Gambia | 2013 | 14.4% | 2013 | 60.0% | 2013 | 32.6% |
| Georgia | 2017 | 4.9% | 2017 | 46.9% | 2017 | 22.2% |
| Germany | 2007 | 0.8% | 2007 | 0.8% | 2007 | 0.0% |
| Ghana | 2017 | 11.3% | 2017 | 56.7% | 2017 | 36.0% |
| Greece | 2001 | 0.2% | 2001 | 3.8% | ||
| Grenada | 1999 | 4.0% | 1999 | 18.0% | ||
| Guadeloupe | 2006 | 0.8% | 2006 | 0.3% | 2006 | 0.8% |
| Guam | 2010 | 0.1% | ||||
| Guatemala | 2015 | 5.0% | 2015 | 19.6% | 2015 | 13.4% |
| Guinea | 2016 | 32.8% | 2016 | 75.3% | 2016 | 59.0% |
| Guinea-Bissau | 2014 | 41.0% | 2014 | 78.0% | 2014 | 61.7% |
| Guyana | 2014 | 1.3% | 2014 | 5.5% | 2014 | 4.4% |
| Haiti | 2017 | 8.1% | 2017 | 56.5% | 2017 | 37.5% |
| Honduras | 2017 | 2.0% | 2017 | 4.2% | 2017 | 3.0% |
| Hungary | 1990 | 5.0% | 1990 | 28.9% | ||
| India | 2016 | 23.8% | 2016 | 63.7% | 2016 | 50.5% |
| Indonesia | 2018 | 35.2% | 2018 | 66.9% | 2018 | 49.6% |
| Iran (Islamic Republic of) | 2015 | 1.8% | 2015 | 4.6% | 2015 | 0.8% |
| Iraq | 2018 | 0.5% | 2018 | 4.6% | 2018 | 1.8% |
| Ireland | 2006 | 0.0% | 2006 | 0.5% | ||
| Italy | 2001 | 3.9% | ||||
| Jamaica | 2014 | 0.0% | 2014 | 1.2% | 2014 | 0.6% |
| Jordan | 2016 | 0.3% | 2016 | 0.7% | 2016 | 0.4% |
| Kazakhstan | 2015 | 3.2% | 2015 | 21.0% | 2015 | 11.5% |
| Kenya | 2017 | 21.2% | 2017 | 54.1% | 2017 | 46.2% |
| Kiribati | 2014 | 0.0% | 2014 | 0.0% | 2014 | 0.0% |
| Kyrgyzstan | 2014 | 1.1% | 2014 | 11.3% | 2014 | 8.1% |
| Lao People’s Democratic Republic | 2017 | 9.0% | 2017 | 46.0% | 2017 | 34.7% |
| Latvia | 2003 | 2.4% | 2003 | 12.5% | ||
| Lebanon | 2016 | 10.9% | ||||
| Lesotho | 2015 | 5.5% | 2015 | 27.8% | 2015 | 21.4% |
| Liberia | 2016 | 58.7% | 2016 | 74.7% | 2016 | 65.3% |
| Libya | 1995 | 35.8% | 1995 | 26.9% | 2014 | 19.1% |
| Madagascar | 2016 | 24.5% | 2016 | 61.6% | 2016 | 57.6% |
| Malawi | 2017 | 16.3% | 2017 | 86.0% | 2017 | 73.8% |
| Malaysia | 2003 | 0.8% | 2003 | 6.7% | ||
| Maldives | 2014 | 0.1% | 2014 | 0.2% | 2017 | 0.5% |
| Mali | 2018 | 19.5% | 2018 | 72.3% | 2018 | 56.2% |
| Marshall Islands | 2017 | 0.2% | 2017 | 2.5% | 2017 | 0.6% |
| Martinique | 1999 | 0.5% | 2015 | 0.4% | ||
| Mauritania | 2015 | 6.5% | 2015 | 49.4% | 2015 | 29.1% |
| Mayotte | 0.0% | 2013 | 2.5% | |||
| Mexico | 2017 | 0.8% | 2017 | 9.5% | 2017 | 2.8% |
| Micronesia (Federated States of) | 2010 | 3.6% | 2010 | 10.7% | 2010 | 9.1% |
| Mongolia | 2016 | 12.8% | 2016 | 52.7% | 2016 | 25.8% |
| Montenegro | 2013 | 5.1% | 2013 | 29.2% | 2013 | 14.1% |
| Montserrat | 1998 | 2.0% | 1998 | 100.0% | 2001 | 0.1% |
| Morocco | 2012 | 1.0% | 2012 | 27.2% | 2012 | 10.2% |
| Mozambique | 2015 | 21.4% | 2015 | 62.5% | 2015 | 49.6% |
| Myanmar | 2016 | 34.3% | 2016 | 74.8% | 2016 | 64.0% |
| Namibia | 2016 | 0.6% | 2016 | 23.4% | 2016 | 11.8% |
| Nauru | 2011 | 1.6% | 2011 | 0.0% | 2011 | 1.6% |
| Nepal | 2016 | 41.8% | 2016 | 46.8% | 2016 | 44.4% |
| New Caledonia | 2014 | 3.1% | ||||
| Nicaragua | 2014 | 4.4% | 2014 | 59.9% | 2016 | 21.4% |
| Niger | 2017 | 33.9% | 2017 | 71.0% | 2017 | 49.5% |
| Nigeria | 2018 | 45.3% | 2018 | 73.1% | 2018 | 60.0% |
| Niue | 1999 | 20.0% | 2010 | 0.0% | ||
| North Macedonia | 2011 | 1.5% | 2011 | 15.1% | 2011 | 7.7% |
| Northern Mariana Islands | 2000 | 1.3% | 0.0% | 2010 | 1.1% | |
| Oman | 2014 | 5.1% | 2014 | 10.0% | 2014 | 6.4% |
| Pakistan | 2016 | 30.4% | 2016 | 44.0% | 2016 | 39.1% |
| Panama | 2015 | 0.7% | 2015 | 14.6% | 2017 | 0.0% |
| Papua New Guinea | 2017 | 2.8% | 2017 | 7.5% | 2017 | 7.1% |
| Paraguay | 2017 | 2.1% | 2017 | 9.2% | 2017 | 4.8% |
| Peru | 2017 | 1.5% | 2017 | 11.1% | 2017 | 3.8% |
| Philippines | 2017 | 8.4% | 2017 | 37.6% | 2017 | 23.9% |
| Portugal | 2001 | 0.1% | 2001 | 0.7% | ||
| Puerto Rico | 1995 | 1.8% | ||||
| Republic of Korea | 2015 | 1.0% | ||||
| Republic of Moldova | 2012 | 16.9% | 2012 | 65.1% | 2012 | 47.1% |
| Réunion | 2015 | 0.2% | ||||
| Romania | 1994 | 11.3% | 1994 | 81.0% | ||
| Russian Federation | 2009 | 3.4% | 2009 | 19.5% | 2009 | 8.6% |
| Rwanda | 2017 | 17.2% | 2017 | 58.4% | 2017 | 50.4% |
| Saint Kitts and Nevis | 1999 | 27.0% | 1999 | 27.0% | 2007 | 0.3% |
| Saint Lucia | 2012 | 0.5% | 2012 | 2.0% | 2012 | 1.6% |
| Saint Vincent and the Grenadines | 1999 | 20.0% | 2012 | 0.1% | ||
| Samoa | 2016 | 2.6% | 2016 | 5.6% | 2016 | 5.0% |
| Sao Tome and Principe | 2010 | 4.5% | 2010 | 11.7% | 2010 | 6.9% |
| Saudi Arabia | 2017 | 0.2% | ||||
| Senegal | 2017 | 7.2% | 2017 | 35.0% | 2017 | 22.5% |
| Serbia | 2014 | 2.4% | 2014 | 11.7% | 2014 | 6.2% |
| Sierra Leone | 2017 | 54.7% | 2017 | 68.9% | 2017 | 62.6% |
| Sint Maarten (Dutch part) | 2011 | 7.4% | ||||
| Slovakia | 2003 | 2.3% | 2003 | 2.3% | 2011 | 13.1% |
| Solomon Islands | 2015 | 8.6% | 2016 | 27.6% | 2015 | 17.5% |
| Somalia | 2017 | 9.5% | 2017 | 60.5% | 2017 | 34.1% |
| South Africa | 2017 | 0.5% | 2017 | 10.1% | 2017 | 3.8% |
| South Sudan | 2017 | 66.5% | 2017 | 80.1% | 2017 | 77.3% |
| Spain | 2003 | 0.6% | 2003 | 0.3% | ||
| Sri Lanka | 2016 | 17.3% | 2016 | 51.0% | 2016 | 45.3% |
| Sudan | 2014 | 2.2% | 2014 | 13.2% | 2014 | 9.8% |
| Suriname | 2017 | 3.1% | 2017 | 5.4% | 2017 | 3.8% |
| Syrian Arab Republic | 2018 | 4.2% | 2018 | 11.6% | 2018 | 8.4% |
| Tajikistan | 2017 | 5.2% | 2017 | 18.7% | 2017 | 15.4% |
| Thailand | 2016 | 1.8% | 2016 | 6.2% | 2016 | 4.2% |
| Timor-Leste | 2016 | 20.0% | 2016 | 33.6% | 2016 | 29.9% |
| Togo | 2017 | 36.6% | 2017 | 61.2% | 2017 | 51.8% |
| Tonga | 1999 | 28.0% | 1999 | 24.0% | 1996 | 1.7% |
| Trinidad and Tobago | 2011 | 0.9% | 2011 | 1.0% | 2011 | 0.9% |
| Tunisia | 2015 | 0.5% | 2015 | 10.8% | 2015 | 3.7% |
| Turkey | 2013 | 5.0% | 2013 | 40.0% | 2013 | 13.0% |
| Turkmenistan | 2016 | 4.4% | 2016 | 34.3% | 2016 | 22.6% |
| Turks and Caicos Islands | 1999 | 22.0% | 1999 | 40.0% | 2012 | 1.7% |
| Tuvalu | 2007 | 1.7% | 2007 | 0.5% | 2007 | 1.1% |
| Uganda | 2017 | 35.8% | 2017 | 79.6% | 2017 | 71.9% |
| Ukraine | 2018 | 11.5% | 2018 | 61.2% | 2018 | 27.8% |
| United Arab Emirates | 2003 | 0.2% | 2018 | 0.1% | ||
| United Republic of Tanzania | 2017 | 19.4% | 2017 | 50.5% | 2017 | 41.2% |
| United States of America | 2015 | 3.0% | 2015 | 45.2% | 2015 | 11.1% |
| Uruguay | 2017 | 0.0% | 2017 | 3.1% | 2017 | 0.2% |
| Uzbekistan | 2015 | 6.9% | 2015 | 22.7% | 2015 | 14.2% |
| Vanuatu | 2016 | 1.6% | 2016 | 4.8% | 2016 | 4.0% |
| Venezuela (Bolivarian Republic of) | 2011 | 4.3% | 2011 | 25.6% | 2011 | 6.8% |
| Viet Nam | 2016 | 19.5% | 2016 | 57.2% | 2016 | 45.2% |
| West Bank and Gaza Strip | 2017 | 1.2% | 2017 | 3.2% | 2017 | 1.5% |
| Yemen | 2013 | 2.3% | 2013 | 43.1% | 2013 | 31.6% |
| Zambia | 2015 | 26.7% | 2015 | 76.8% | 2015 | 55.8% |
| Zimbabwe | 2017 | 11.1% | 2017 | 77.5% | 2017 | 57.0% |
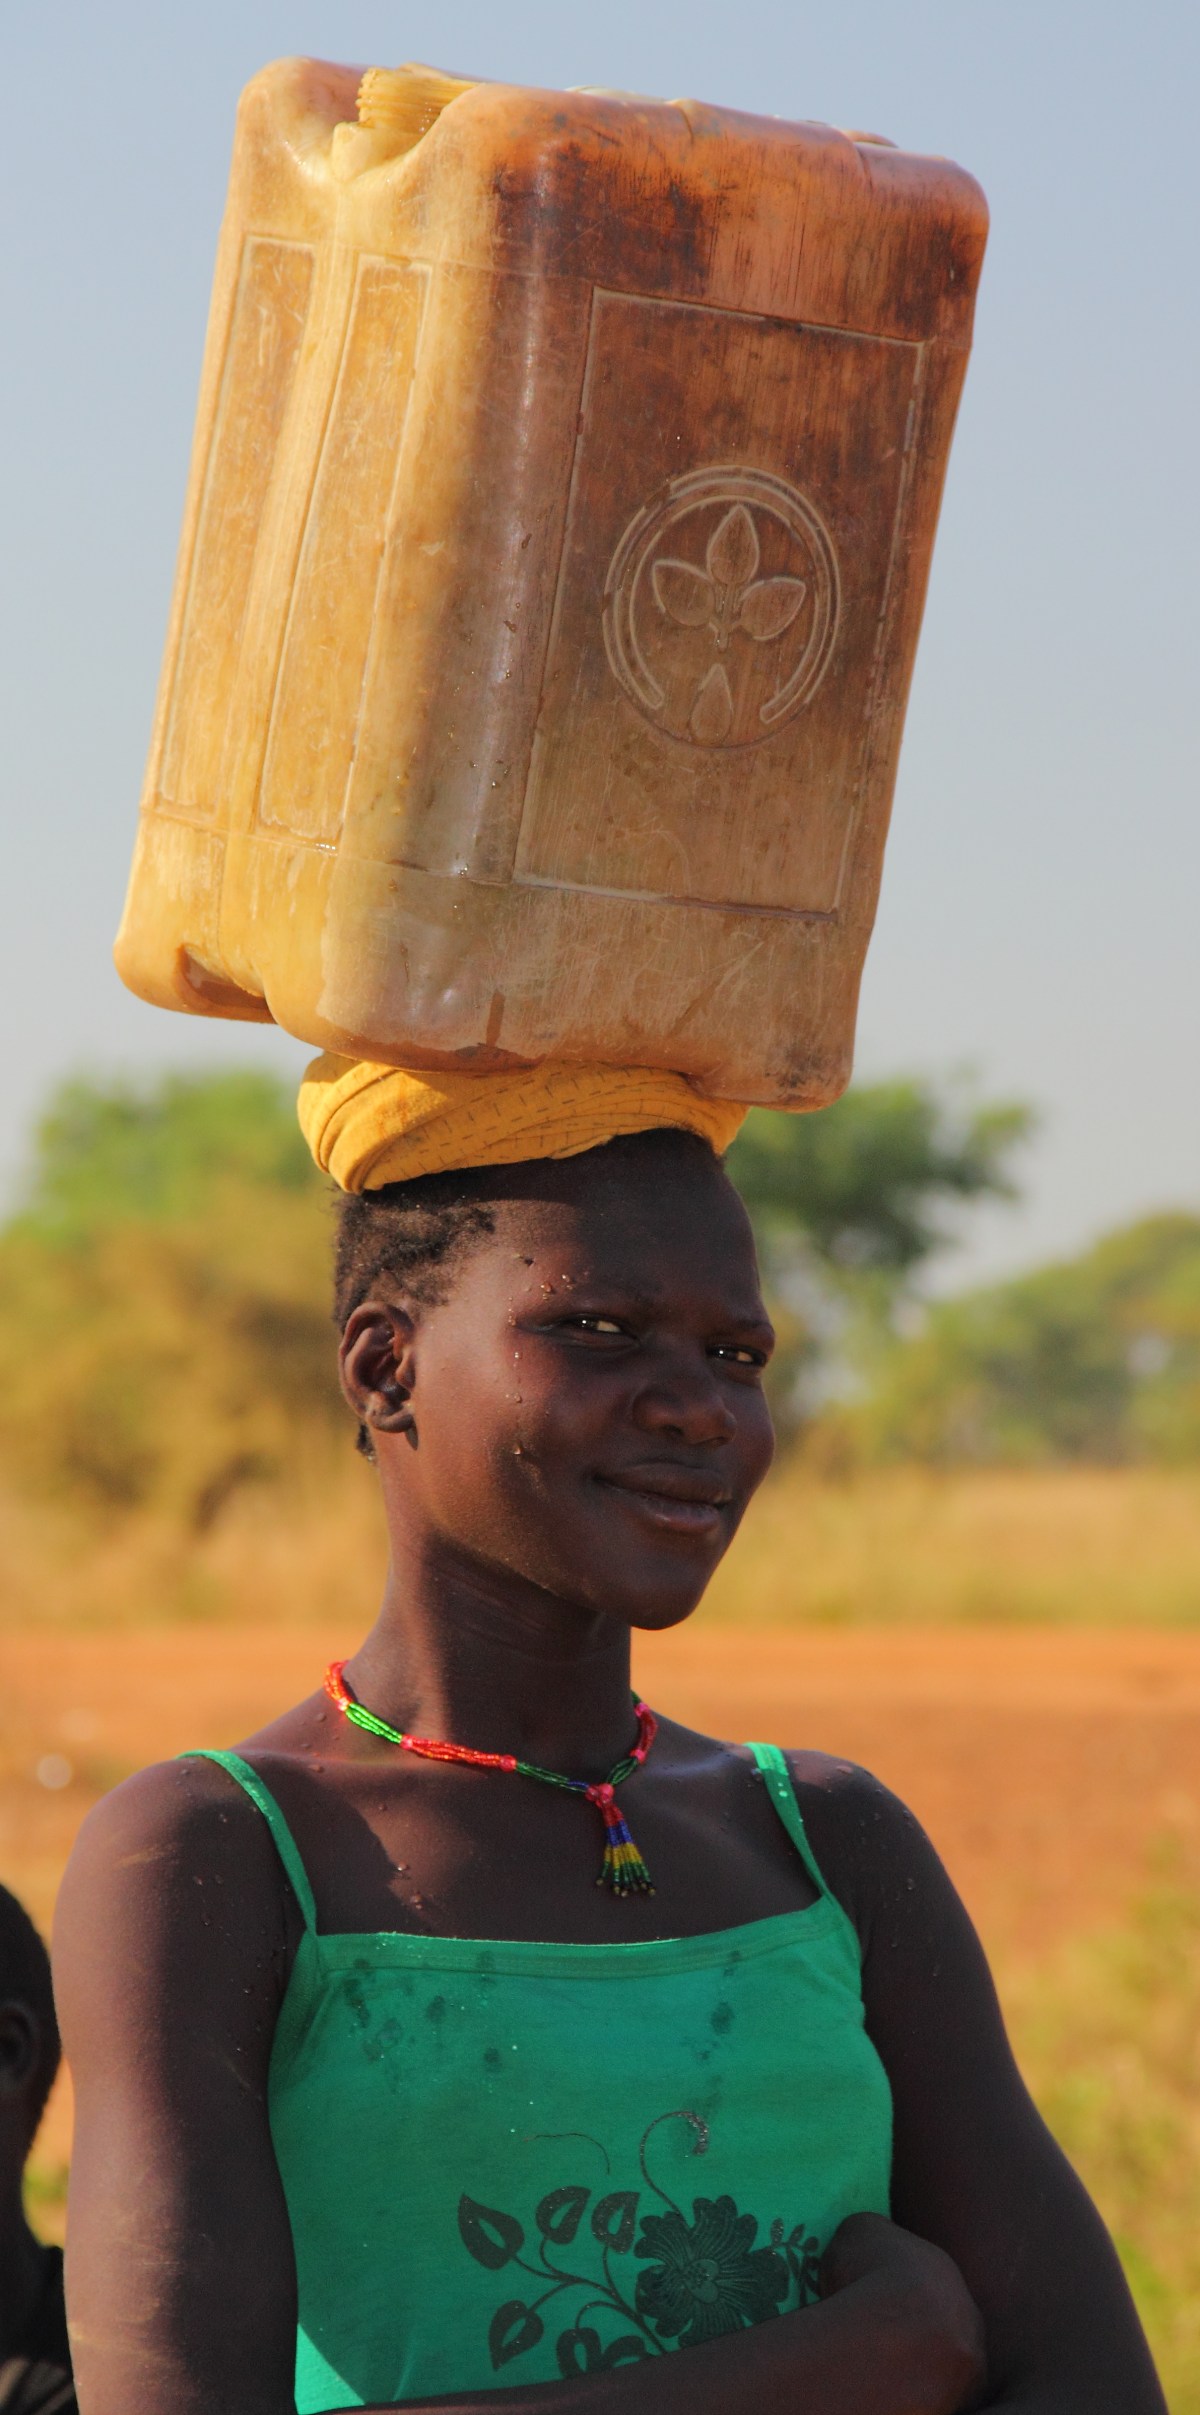
Photo: Groundwater provides over 80% of the rural population with its main source of drinking water in South Sudan. Photo taken in 2014 in Northern Bahr el Ghazal by Kerstin Danert.
