Nearly 30 years ago I began my first steps into a career in Water, Sanitation and Hygiene (WASH) in Guatemala. In the morning mist, there was the dull clank of the school bell. It was an old bombshell that had been dropped on the village at some point during the thirty-year civil war. On that day it was guiding children to lessons. The clothes of the people, particularly the women, were amazing. Incredibly colourful and ornately woven, and each is distinctive to that community.
Today, my job is a different type of weaving, but no less colourful. In my previous post, I described how we, as RWSN and SuSanA, have been working with the Multilateral Development Banks, bilateral aid agencies, NGOs and researchers to weave a new narrative for rural WASH – one of learning from each other to achieve universal and lasting access.
But success doesn’t come from top-down actions only, there also needs to be a meeting with bottom-up energy, experience and initiative. Thanks to the support from SDC and IDB, through the SIRWASH project, we have had the opportunity to connect and listen to what regional practitioners are interested in and find ways to collaborate.
On 24 October, our partner, Lourdes Valenzuela from Aguatuya/SuSanA Latinoamérica co-hosted an online meeting with fellow WASH networks: “Conversatorio virtual: Escuchando las voces del sector de agua y saneamiento rural en Latinoamérica” (Online Conversation: Listening to the Voices of Rural Water and Sanitation Leaders in Latin America)
This 80-minute session, co-hosted with COLSAR, connected experts from diverse backgrounds to identify current sector demands and innovative approaches for improving rural water and sanitation management.
Themes and Objectives
The session, moderated by Marcelo Encalada from LatinWASH, sought to:
Identify essential knowledge areas and skills for strengthening rural water and sanitation services.
Explore digital tools and resources that could improve access to critical knowledge.
Examine the role of digital platforms such as SuSanA and LatinWASH in promoting sustainable solutions.
by Sean Furey, Director – RWSN Secretariat @ Skat Foundation
Rural Water, Sanitation and Hygiene (WASH) is such a local, personal, issue that does global-level exchange make sense?
At first glance, rural areas and communities worldwide seem too diverse for networking and knowledge exchange to be useful or meaningful. What does WASH for isolated hamlets in the Nepalese Himalayas have in common with a fishing village on the Peruvian coast or a small town in northern Nigeria? Quite a lot, it turns out.
When it comes to shear financial clout and convening power, Multi-lateral Development Banks (MDBs) are hard to beat, but even they have had mixed success with rural WASH – but there have been successes and they have recognised that they can learn from each other so that they can provide their client governments with the technical assistance and financial options to deliver sustained improvements. So, last year the relevant focal points from the African (AfDB), Asian (ADB) and Inter-American (IDB) met and agreed on a Call to Action with three priorities:
Information-based decision-making and rural WASH investments and service monitoring.
Institutional strengthening & coordination.
Rural sanitation.
From this, we organised a webinar mini-series drawing on their recommendations for case studies on each topic from each region.
Finding the common threads and bringing them together to make them stronger
This year, we took more steps to build an understanding and appreciation of the solutions that have the potential to transcend the variability of local contexts and be adapted. With growing interest, our colleagues at the World Bank also joined the small group and together we organised a special SIRWASH breakfast meeting and an open session on “Coordinating Rural Water Investments to Promote Security and Stability” with REAL-Water :
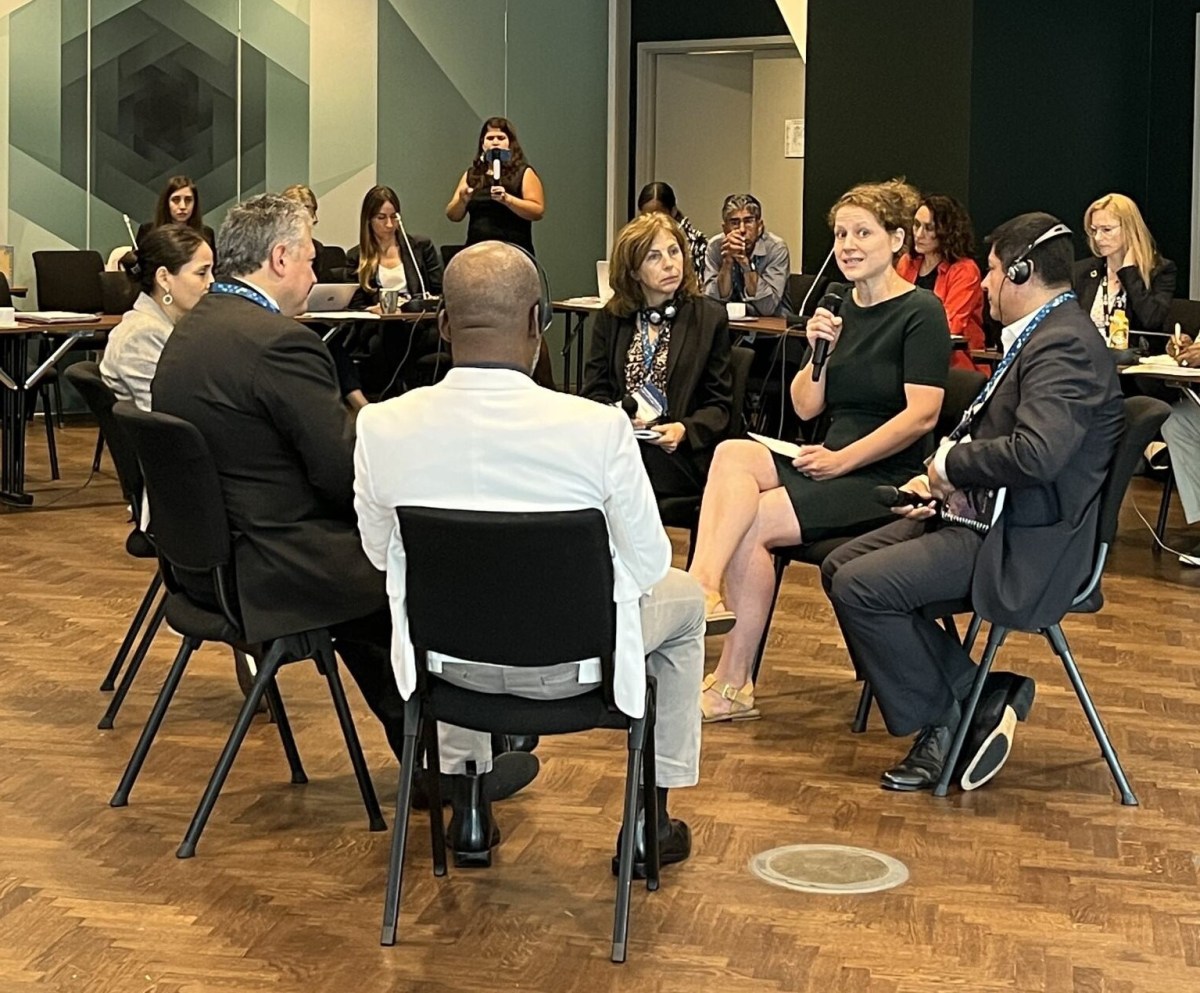
The SIRWASH breakfast meeting that followed was in the spirit of collaboration among countries in the global south, using knowledge sharing as a catalyst for innovative and sustainable solutions. It was attended by more than 40 representatives from countries (Haiti, Brazil, Peru, Chile, Nigeria and Uganda), multilateral banks, multilateral and bilateral agencies (SDC, AECID, SIDA, WHO, OAS, UNICEF), NGOs and philanthropists (including, One Drop, Water For People, Avina, Aguatuya, mWater, Global Water Center), as well as networks, partnerships and research (RWSN, SuSanA, WASH Agenda for Change, WASH Funders Group, SIWI, Uptime, the Aquaya Institute).
Using the “Fishbowl” method, participants exchanged their perspectives in an open and dynamic way on how strategic partnerships can increase impact in the sector. Discussions focused on two key questions:
1. How can technological innovations in rural WASH information systems be supported to be truly effective in decision making and incentivize scaling up?
2. What are practical solutions to improve the design and implementation of national rural WASH programs so that their benefits are sustained over the long term?
One of the central themes was innovation through sector information systems, a crucial tool for planning and managing water and sanitation services in rural areas. Three countries shared their experiences on how they have adapted and improved these systems:
Haiti highlighted the use of information systems for decision-making;
The importance of institutionalizing information at the national level and ensuring that communities participate in the validation and appropriation of data and decisions was emphasized.
In addition to information systems, the event underscored the need to integrate both technological and social innovations to improve rural services. Social innovations and behavioural change are essential for communities to take ownership of the systems and actively participate in their management and maintenance. Participants agreed that long-term sustainability is about finding the sweet spot between community-ownership/responsibility and external support.
The second critical issue addressed was the sustainability of rural water and sanitation services. Participants stressed that the successful implementation of these services cannot depend solely on initial investments in infrastructure. Innovative mechanisms need to be developed to ensure their financing and continued operation. The examples of Brazil and Nigeria were instructive, both countries demonstrating how the combination of effective governance and innovative financial models can ensure the operational sustainability of services:
Brazil presented its comprehensive implementation of their National Rural Sanitation Program (PNSR).
Nigeria highlighted the ways a results-based SURWASH programme is strengthening institutional capacity.
The Uptime Consortium shared their experiences and successes with Results-based Contracting on rural water service delivery across many contexts.
The discussion emphasized the need for functionality and quality indicators for rural services, linking reliable information to financial incentives for operators. This strategy can enhance the long-term sustainability of these systems. The working group concluded that collaboration is essential to ensure countries have reliable information for decision-making, aimed at improving the quality of rural services.r decision-making aimed at enhancing the quality of services in rural areas.
In the final discussion, consensus was reached on the need to create and maintain an enabling ecosystem for the development and sustainability of rural services. The great opportunity for development partners to join efforts and seek synergies, contributing technical and financial resources to this ecosystem in the countries was highlighted.
The event concluded with a clear call to action: all actors – governments, development banks, cooperation agencies, NGOs, networks and the private sector – must remain committed to financing and strengthening rural water and sanitation services. The MDBs will continue to work together on a concrete action plan to exchange and replicate successful and innovative experiences to ensure universal and quality WASH services in the countries.
Knowledge exchange is not just talk and powerpoint presentations, it is about building connections and trust between individuals and organisations, finding those common interests and encouraging co-creation of new insights and more sustainable solutions.
The symbolic activity organized by One Drop, where participants bonded to represent their intention to work together towards a common goal, was a powerful reminder of the importance of lasting partnerships. This symbolic gesture is just the beginning; it is essential to continue to scale up efforts so that the most vulnerable communities can access quality water and sanitation services in a sustainable and equitable manner.
Top-Down meets Bottom-Up
After this event, our partner Aguatuya convened an online meeting of Latin American WASH networks to encourage bottom-up exchange to complement our high-level approach. But we will follow that thread in the next post…
Many thanks to the large number of people involved, but in particular to Sergio Campos, Manuela Velasquez-Rodriguez and Cristina Mecerreyes at IDB; Diane Arjoon at AfDB, Vivek Raman and Tanya Huizer at ADB, Awa Diagne and Sarah Nedolast at the World Bank, Janine Kuriger at SDC, and to the wonderful RWSN/SuSanA team: Dr Aline Saraiva, Batima Tleulinova, Susanna Germanier, Lourdes Valenzuela, Paresh Chhajed, Chaiwe Sanderse and all the speakers and panellists for the webinars and sessions.
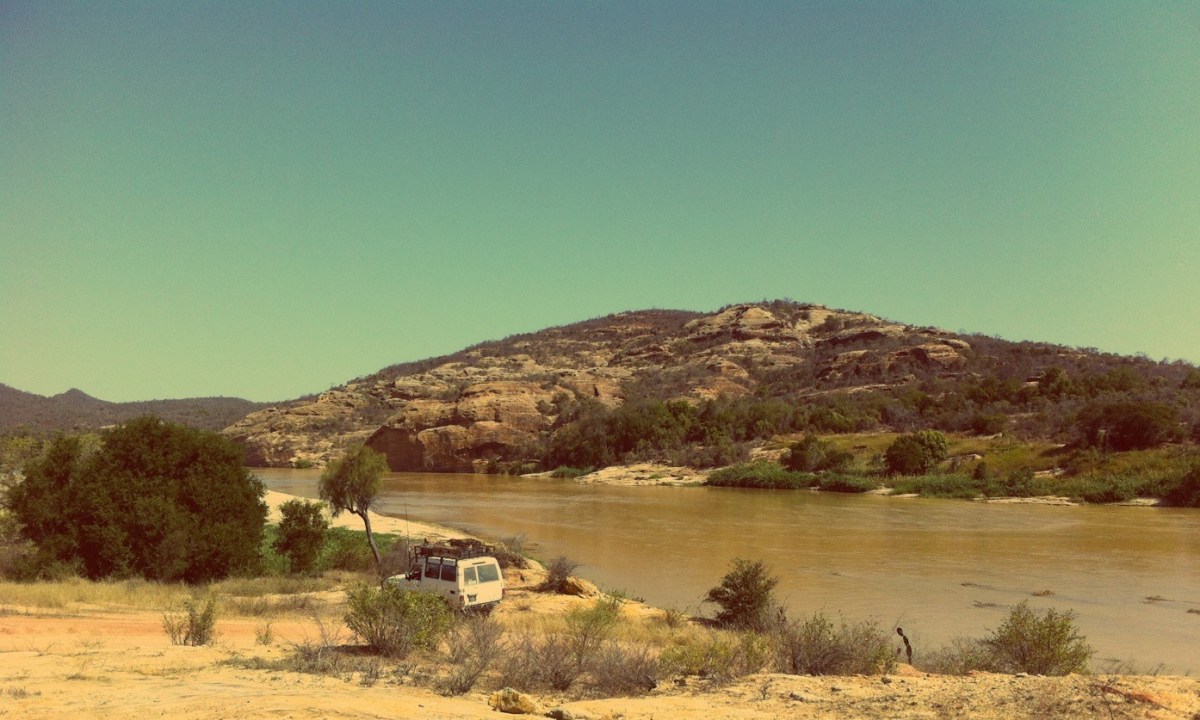
BushProof Sàrl, drawing on more than 15 years’ experience of working in southern Madagascar, supported by two hydrogeologists from the Swiss Agency for Development and Cooperation (SDC), set out to work in an appropriate way on knowledge of aquifers in the regions of southern Madagascar. Together, they financed and created a mapping tool to improve knowledge of the functioning of groundwater in southern Madagascar, which was completed in 2023.
The south of the island of Madagascar has been experiencing prolonged periods of drought for several years. The growing local populations there now have very limited access to water, leading to deteriorating living conditions. However, large quantities of water flow through this area via aquifers whose functioning remains poorly understood.
BushProof Sàrl, mettant à profit une expérience de travail de plus de 15 ans dans le Sud de Madagascar, appuyé par deux hydrogéologues de la Direction du Développement et de la Coopération (DDC), s’est proposé de travailler de manière appropriée sur la connaissance des aquifères des régions du Sud de Madagascar. Ensembles, ils ont financé et créer un outil cartographique afin d’améliorer la connaissance du fonctionnement des eaux souterraines dans le Sud de Madagascar. Cet outil a été réalisé en 2023.
Le Sud de l’île de Madagascar connait, depuis plusieurs années, des périodes prolongées de sécheresse. Les populations locales grandissantes y ont aujourd’hui un accès très restreint à l’eau, ce qui engendre des conditions de vie dégradées. Pourtant, d’importantes d’eau transitent dans cette zone via des aquifères dont le fonctionnement reste mal connu.
En el ultimo post, se mostraron las herramientas para el manejo de activos que se estan desarrollando por la Alianza WASH Internacional. Las experiencias previas demostraron que utilizar un enfoque basado en los usuarios es importante para incrementar el impacto de los proyectos. Para este caso, las actividades principales incluyeron un mapeo de usuarios y sus necesidades, diseño de herramientas y pruebas en campo asi como su promocion en las comunidades.
Aditi Goyal, coordinadora de Smart-tech se refiere al proceso de diseño como uno basado en pequeñas iteraciones.
“Hay muchas maneras de llegar al mismo punto. Lo importante es llegar a donde el usuario necesita que lleguemos“
Ella se refiere a las características, usabilidad y adaptabilidad de las herramientas que se están desarrollando. Destacando la importancia de escuchar los puntos de vista de todos los actores que se encuentra involucrados en el proyecto. De experiencias previas, Aditi está consciente que los primeros borradores siempre tienden a ser completamente diferentes a lo que se entregan como producto final. Sin embargo, el proceso de confrontar y discutir las ideas conlleva a una etapa de maduración de las mismas.
El proceso
A continuación, se presenta el proceso que se ha adoptado para el desarrollo de las herramientas para el manejo de activos:
1. Mapeo de usuarios y sus necesidades
El proceso comienza con trabajo de campo, interactuando con las comunidades locales para entender el contexto en el cual se van a utilizar las herramientas. Este proceso incluye un mapeo de quienes serán los usuarios finales, definir sus características en relación a sus medios de vida, conexión a internet, nivel educación y a la manera en la que actualmente obtienen y utilizan la información relacionada a sus sistemas de agua. Definitivamente, esto contribuye a determinar acertadamente cuales son las características de las herramientas que harán la vida de los usuarios mas fácil. Un enfoque participativo e inclusivo asegura que los grupos vulnerables sean tomados en cuenta durante todo el proceso.
2. Diseño y desarrollo del producto
En esta sección se aborda la forma final que tendrán las herramientas, así como su contenido. Este proceso se lleva a cabo por medio de múltiples iteraciones que deben incluir a todos los actores. De acuerdo a la experiencia de la Alianza WASH Internacional, un buen mapeo de necesidades siempre facilita el proceso de diseño. Comúnmente, este proceso se lleva a cabo por medio de trabajo de campo. Sin embargo, debido a las restricciones impuesta por la pandemia de Covid-19, esto no fue posible para este proyecto.
3. Pruebas, promoción y entrega de las herramientas.
Este proceso no se ha realizado aún. Una vez que las herramientas hayan sido programadas y probadas por las organizaciones locales en Nepal (CIUD y Lumanti) se va a identificar y a proveer de apoyo técnico a una institución local que se encargue de implementar y adoptar las herramientas en todo el país. La aplicación web, el tablero de control y la herramienta de aprendizaje online serán circuladas con todos los grupos para los que ha sido diseñada. Las herramientas se encuentran en un ambiente publico para permitir cambios y mejoras conforme son necesarios (para este proyecto, el ambiente de Moodle ha sido seleccionado). El software recibirá mantenimiento por los próximos 5 años, por la misma compañía que lo desarrollo.
Lecciones aprendidas…hasta ahora.
Algunas reflexiones finales han sido obtenidas de las discusiones que han tomado lugar en el proyecto.
Los comentarios de los usuarios son de suma importancia para lograr herramientas robustas. El equipo de diseño necesita pasar tiempo en el campo, entrevistando a los futuros usuarios y entendiendo las necesidades reales. Muchas veces, lo que creemos que necesitan los usuarios, tiende a ser completamente diferente a lo que realmente necesitan. Flexibilidad, comunicación y buena planeación ayudan a solventar las dificultades en los proyectos. Por ejemplo, para este proyecto no fue posible realizar trabajo de campo debido a las restricciones impuestas por Covid-19. Para superar esto Smart-tech distribuyó las herramientas con el personal de campo para verificar su usabilidad y obtener comentarios con respecto a su implementación en condiciones reales. Estas acciones incrementan la comunicación entre los actores involucrados, ayudando a alcanzar las metas de una manera mas eficiente. Como se refiere Aditi:
‘Tener una planeación adecuada ha sido importante para el proyecto, ya que permite monitorear los productos y revisar si se han alcanzado las metas en tiempo y forma’
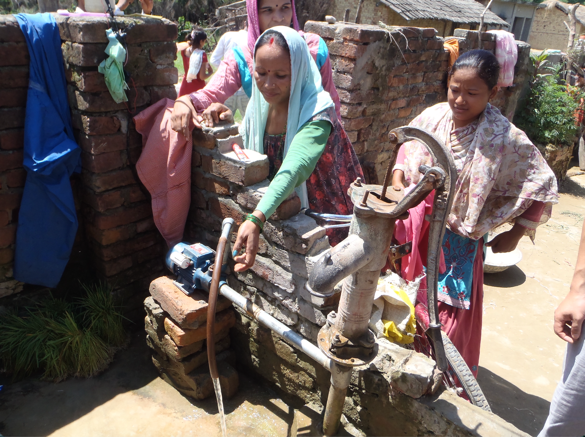
Agradecimiento especial para Aditi Goyal por su participación al proveer información para este blog. Este documento has sido creado por la Fundación Practica como miembro de la Alianza WASH Internacional, como p arte del Consorcio WASH SDG. Para mas información por favor contactar: info@practica.org; o visita http://www.practica.org. Foto: CIUD Nepal.
In the last blog post, the Asset Management tools under development by the WASH Alliance International were presented. Previous experiences demonstrated that including user-centered approaches is key to increase the impact of project activities. The main activities for this project include a needs’ assessment, user story mapping, tool design, field testing promotion and the roll out of the tools.
Aditi Goyal, the e-learning development coordinator at Smart-tech, a Nepalese tech company, refers to this project as a continuous iterative process.
“There are many ways to get to the same place. The important thing here is to get where users take us”
She is referring to the features, usability and adaptability of the tools under development. Highlighting the importance of listening to everyone’s point of view represents an advantage for project implementation. From her previous experiences, she knows that first drafts tend to differ completely to what is delivered as final products. However, they are useful for the maturity process in which the ideas are confronted, shared and thus improved by a continuous feedback process.
The roadmap
Below, we present the process adopted to develop the asset management tools:
1. Need’s assessment and user story mapping
We began the process by going into the field. Enabling the interaction with local communities and understanding the context where the asset management tools would be piloted. This process included mapping of the potential users, defining their characteristics in terms of livelihoods, internet connectivity, literacy rates, and their current way of collecting and using information to perform works related to water system management. This supported in defining what the tools need to do to make their lives easier. A participatory and inclusive approach has been adopted to ensure that vulnerable groups and their needs were also considered in the whole process.
2. Design and development
This included deciding how the tools would look like, how the information would be presented, and the content that needed to be prioritized. This has been a lengthy process since multiple iterations needed to be done until all involved actors agreed on the final product. From the WASH Alliance International experience, a good needs’ assessment will always facilitate the design process. Normally, fieldwork should take place during the iterations to assess whether the development process is on the right track. However, due to the restrictions imposed by the spread of Covid-19, it was not possible to conduct all field verifications during this phase.
3. Testing, promotion and scaling of the tools.
This process has not taken place yet. Once the tools have been programmed and tested, the local partners of the WASH Alliance International in Nepal (CIUD and Lumanti) will identify and provide technical assistance to the institutional hosts who will monitor the implementation and adoption of the tools throughout the country.
The app, dashboard and the e-learning tool will be circulated among different target groups. The tools will be provided in an open-source environment to enable further scaling and improvement (for example for the e-learning Moodle has been selected). The software will be technically maintained and updated for a period of 5 years by the contracted software company.
Lessons learned…so far.
Key lessons have been extracted from the discussions with involved stakeholders regarding their experiences in this and other related projects.
User feedback is extremely important to make a robust tool. The team needs to spend time in the field, talking to future users and understanding their main needs. What we think users want and what they actually need is often quite different.
Flexibility, communication and good planning helps to overcome difficulties in projects. For example, there was no possible to conduct fieldwork due to Covid-19 restrictions. To overcome this issue SmartTech shared the tools with local field officers to do the verification and to obtain feedback about the usability and operability of the tools. These actions enhance communication among involved actors, helping to achieve goals in a more efficient way. As Aditi refers:
‘Following the planning schedule has been important since the beginning of the project, it helps me to track the deliverables and to see whether the goals have been achieved on time’.
Special thanks go to Aditi Goyal for her insights on the process of tool development. This document was developed by Practica Foundation as a member of the WASH Alliance International, partner of the WASH SDG Consortium. For more information please contact: info@practica.org; or visit http://www.practica.org. Photo credit: CIUD, Nepal.
This is a guest blog by Meghan Miller. Meghan is completing her PhD in the Department of Environmental Sciences and Engineering at the University of North Carolina at Chapel Hill and has conducted both her masters and doctorate research through The Water Institute.
The Water Institute recently published a systematic review on external support programs (ESPs) that target rural, often community-managed water systems. ESPs are of vital importance to long-term functionality and sustainability of rural drinking water service, as all water systems fail eventually and rural water committees can lack the resources and/or capacity to rehabilitate the systems independently.
The purpose of the systematic review was to determine how ESPs in low-, medium- and high-income countries are described and measured. The aims of the analysis were to: create a typology of ESP activities based on ESPs for rural drinking water systems; identify barriers to ESP access and implementation; and determine how ESPs effect the sustainability of rural water systems.
So what do external support programs do?
The types of ESP activities described in the literature were: technical assistance, financial assistance, monitoring and regulation, communication and coordination, administrative assistance, capacity-building, and creation of policies and enforcement of regulations. Technical assistance, financial assistance, and capacity-building were described in the majority of publications included (66%, 57%, and 53% respectively).
Need for a typology of activities and precise language
The language used to describe ESPs was not consistent between publications about low-, middle-, and high-income countries. When ESP activities go underreported, knowledge transfer is limited and support for ESPs is reduced. Communication and coordination between ESP providers is further limited by inconsistent and imprecise language. We identified twenty-one terms that were used to describe ESPs. Some terms imply that support occurs at specific phases or with specific actors. Post-construction support, for example, assumes that projects have a single construction event. The terminology should reflect how and when support is provided. The better ESP terminology is defined, the better we can compare ESPs in different settings.
External support was the most commonly used term (27% of publications) and we propose using the term “external support programs” to describe the continued support for water systems. Based on our analysis we propose the following definition for ESPs: “the set of activities provided by NGOs, government, private and community-based entities to community-member managers to ensure continued safe operation of a drinking water system.”
What are the barriers to external support programs?
Barriers to ESPs were grouped into six categories: inadequate resources, inadequate ESP support, restrictive policies, lack of communication and coordination, little access to ESPs, and insufficient training of water system managers. The barriers to ESP varied by country income classification. Lack of communication within ESPs and between ESPs and stakeholders was most frequently mentioned in publications about high-income countries (36% of the publications); lack of communicate was often characterized by unclear roles and responsibilities, lack of trust between ESPs and stakeholders, inability to resolve disputes and misunderstanding of local context. Insufficient training of staff and insufficient resources for ESP wa identified as the most common barriers to ESP in publications about low and lower-income countries (57% and 45% of publications respectively).
Little comprehensive monitoring and assessment of ESPs
Twenty studies evaluated the effects of ESPs on water service levels. Most publications described ESP activities but did not undertake data collection to assess the programs. Without a rigorous assessment of ESPs, it is difficult to identify the most effective components of ESPs. Proper monitoring requires that stakeholders understand the activities and models implemented by ESP providers. Presence of ESPs and access to spare parts were used as the indicators of ESP activity by studies assessing the effect of ESPs on households and water systems. Better monitoring would include indicators that measure the six types of ESP activities, such as the frequency and attendance rate of water committee training events. Indicators should also measure the effectiveness of different providers – these outcome indicators should be developed according to the type and purpose of the ESP. Additional assessments of ESPs will help stakeholders identify which ESP activities and models promote sustainability. Support programs can then incorporate those that promote sustainability.
Majority of publications report on ESPs for point sources
The majority of publications addressed ESPs for point sources. The focus on point sources ignores water sources in community institutions and the implementation of more complex water systems. Community institutions, such as schools and health care facilities, have different water use characteristics and management structures than community drinking water systems and support to these community institutions will require adaptations to existing ESPs. Piped water systems, compared to point sources, are more complex, have larger one-time repair costs, typically require repairs more frequently, may require specialist technicians, and may require more expensive parts. Descriptions of ESPs in community settings and for more complex systems will improve knowledge about how ESPs for can be adapted to better serve community needs.
Further reading
The full article is available as:
Miller, M., Cronk, R., Klug, T., Kelly, E.R., Behnke, N., Bartram, J., 2019. External support programs to improve rural drinking water service sustainability: A systematic review. Sci. Total Environ. 670, 717–731. https://doi.org/10.1016/j.scitotenv.2019.03.069
Figure: Model of the variables that affect and are affected by external support programs based on data from quantitative and qualitative evaluations of external support programs and review of the literature. Plus signs represent a positive relationship and negative signs represent a negative relationship. The dashed lines represent relationships that have been identified in the literature, but were not assessed in the ESP evaluations. Credit: Authors.
This is a guest blog by Riley Mulhern, a PhD student at the University of North Carolina. If you are interested in issues related to water quality monitoring, you can join our online community here.
In areas of water scarcity around the globe, made worse by climate change and pollution of groundwater, rainwater harvesting remains an important source of water supply for rural communities.
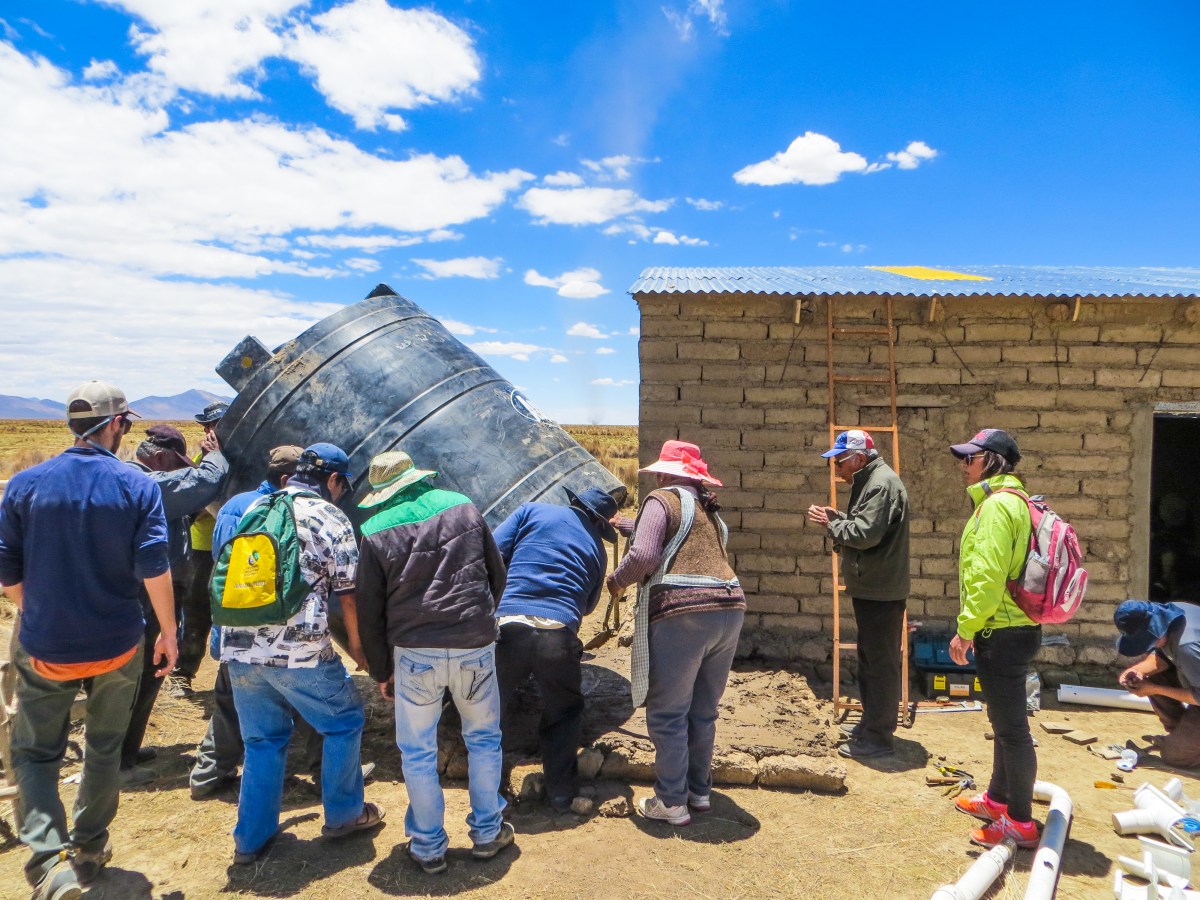
This is especially true in the Bolivian altiplano, where drought and mining work together to create pockets of severe water stress in what is generally considered a water-rich country. I lived among these communities high in the Andes for two years working with an organization called the Centro de Ecología y Pueblos Andinos(Center for Ecology and Andean Peoples, or CEPA). I assisted CEPA with a small-scale rainwater harvesting project for rural communities with high needs.
Over the course of the project, CEPA monitored the quality of harvested rainwater through consecutive wet and dry seasons. Surprisingly, we detected arsenic in every tank we monitored, 18 in total, whereas no microbial contamination was found.
This finding alerted CEPA to the risk of rainwater contamination in the region. Further testing identified roof dust that flushes into the tanks from the roof catchment as the principle source of arsenic in the rainwater. No arsenic was detected in raw rainwater before it interacted with the roof or tank. The source of the arsenic in the dust, whether naturally elevated in the altiplano soil or mobilized due to mining activity and released into the environment, is unknown, but widespread mining contamination in the area is likely a contributor.
Given these findings, the implementation of rainwater harvesting as an alternative drinking water supply by nonprofit groups and charitable organizations without adequate monitoring and evaluation of water quality is a potential concern. Since rainwater is presumed to be arsenic-free, rainwater harvesting has been promoted as an alternative drinking water source in other areas affected by arsenic contamination of groundwater as well, such as Mexico, parts of Central America, and Bangladesh. It is not safe to assume rainwater will be entirely arsenic-free, however. The levels found in collection tanks in Bolivia were double the WHO health guideline of 10 parts per billion.
As a result, arsenic and other metals should be included as standard monitoring parameters in rainwater projects. Groups implementing rainwater harvesting projects should seek additional partners with the tools and knowledge to perform thorough water quality testing.
This can be accomplished either through basic field tests, which provide semi-quantitative information for initial screening, or through laboratory analysis. Research done at North Carolina State University found that the standard field method—where inorganic arsenic in a water sample is reduced to arsine gas, which then reacts with a mercuric bromide strip to turn color—tends to underestimate the actual arsenic concentration as verified by ICP-MS (a sophisticated method that detects counts of atoms in a sample at specific molecular weights, allowing for a precise quantitative measurement). However, these low-cost and easily transportable kits still offer an accessible and simple screening tool for the presence of arsenic. The ITS Econoquick, for example, provides 300 tests with a 0.3 ppb detection limit for less than $200. For more precise measurements and longer term use, the Palintest Arsenator includes a standardized digital reading of the colorimetric output for $1,200. Both kits were field tested by CEPA and were easy to use for untrained operators.
In addition to greater testing, practitioners should also consider the required first flush volume for their project. First flush systems are essential for any rainwater harvesting scenario to mitigate both microbial and chemical risks. This is especially true when used as a drinking water source. One rule of thumb is that first flush systems should be able to capture at least 4 liters of water for every 10 square meters of roof. The tanks monitored in Bolivia did not meet this standard. Thus, the risk of arsenic contamination of rainwater and simple controls for system design and monitoring should also be communicated widely through knowledge platforms such as RWSN and the RAIN Foundation.
The results of this monitoring study were compiled by CEPA and a Belgian organization, the Comité Académico Técnico de Asesoramiento a Problemas Ambientales (CATAPA). The full results have been published and are accessible through the journal Science of the Total Environment. This work has also been featured previously by EngineeringforChange.org.
About the author
Riley Mulhern is a PhD student at the University of North Carolina Chapel Hill Gillings School of Global Public Health. He worked previously as a technical water quality adviser for a Bolivian environmental justice nonprofit addressing issues of mining contamination in rural indigenous communities in Oruro, Bolivia. He is from Denver, Colorado and received his B.S. in physics and geology from Wheaton College in Wheaton, IL and M.S. in Environmental Engineering from the University of Colorado Boulder. He has worked previously on water projects in Nicaragua and Haiti.
Photo: Rainwater tank monitored for the study being installed. Photo credit: Maggie Mulhern.
How many countries have you worked in where an up-to-date national information system for rural water services is used for decision-making?
How many well-intended monitoring initiatives did you encounter which are no longer being used?
Your answers are likely to be “few” and “many”, as government-led information systems to support planning and decision making for fragmented rural water services are not easy to develop, institutionalize, and sustain.
It is widely recognized that information systems are a key building block to achieve sustainable rural services delivery – a top development priority given that 8 out 10 people without basic water services live in rural areas, leaving 628 million people unserved. The good news is that a customizable, tried and tested solution already exists, so that countries can leap-frog a cumbersome development process and – more importantly – go through a fast learning curve when adopting and institutionalizing the Rural Water and Sanitation information System or “SIASAR” as their national rural sector monitoring and evaluation (M&E) system.
Following the initiative of the governments of Honduras, Nicaragua, and Panama, 11 countries in Latin America and the Caribbean are using the innovative open-data platform “SIASAR”. Different actors are using this tool for decision making, strategic planning, rural water performance monitoring, and for taking appropriate actions to prevent services from deteriorating, ensuring that water keeps flowing from the taps and communities receive timely support. SIASAR has been supported by the World Bank since its inception in 2010. In particular, Global Water Security and Sanitation Partnership (GWSP), a multi-donor trust fund housed within the World Bank’s Water Global Practice, provides funding to SIASAR.
With its adaptability and multi-language capability, SIASAR has now been introduced in the Kyrgyz Republic (in Russian and Kyrgyz languages), and a pilot has also been planned in Uganda. Within the context of the Kyrgyz Republic’s national rural water program, supported by the World Bank-supported Sustainable Rural Water Supply and Sanitation Project, SIASAR has now gradually been introduced as the sector’s M&E system, covering data on system status and service provider performance for almost a third of its 1800 remote and mountainous villages. This will help to target investments and achieve the Kyrgyz Government’s vision to reach universal access by 2026.
With support from GWSP and the World Bank’s office in Colombia, the South-South Knowledge Exchange Facility helped bring Kyrgyz and Ugandan delegations together in Colombia. This knowledge exchange allowed them to receive peer-to-peer advice on how to introduce, roll out, and use SIASAR, and to learn about effective policy instruments, regulations, and institutional arrangements for sustainable rural water supply and sanitation service provision.
Specifically, the delegations learned about Colombia’s differentiated policy and regulatory instruments for rural areas, including tariff policies, water quality and environmental regulations, technical standards for water supply and sanitation, financing modalities for investments, and of course the SIASAR information systems for evidence-based decision making. Through field visits, the responsibilities of local and regional governments in rural service delivery in Colombia were better understood. The three-way translation between Spanish, English, and Russian put in place and the excellent collaborative spirit by all parties helped to overcome the communication challenge. These delegates took away important lessons on the adaptation process for SIASAR, such as:
SIASAR implementation and scale-up requires dedicated human and financial resources at the national and regional levels, including both sectoral and IT experts.
A clear roadmap for SIASAR adoption is necessary, bringing in multiple partners to support implementation. Anchoring in national legislation and fostering linkages with other national statistical information systems is critical.
SIASAR can cater analysis to the need of different actors and increases transparency and accountability of service provision.
SIASAR has helped to inform and influence investment programs to close the urban-rural service gap, accompanied by a range of measures to support rural service providers.
Depending on where they were in the adoption of SIASAR, the Kyrgyz delegation was keen to grasp the process of institutionalization, while the Ugandans were exposed to the range of capabilities and practical first steps that have now led to a first pilot, supported by the Uganda Integrated Water Management and Development Project (IWMDP).
Seeing solutions in action can be a great motivation. The knowledge exchange with Colombiastimulated learning and encouraged officials from Kyrgyz and Uganda to try and adopt solutions to their own circumstances. A guide is now available that can help any country go through the process and prepare for the steps of adopting SIASAR.
Preliminary analysis of census and national survey data from the 2019 Joint Monitoring Programme, by Dr Kerstin Danert
An important issue for those of us that think a lot about groundwater is the extent that various countries rely on it for their drinking water.
The data presented in the table below has been prepared from the 2019 data published by the Joint Monitoring Programme (JMP) of the World Health Organisation (WHO) and UNICEF (see https://washdata.org/data). Each country has an associated Country File (an excel spreadsheet) with collated data on Water, Sanitation and Hygiene use. This data is gathered from national censuses as well as household surveys such as the Demographic and Health Surveys (DHS) and Multiple Indicator Cluster Surveys (MICS) and many others. The country files given excel spreadsheets on the JMP website (not to mention the underlying surveys) contain a wealth of data!
The table below shows the percentage of the population that rely on groundwater point sources as their main source of drinking water for every country and territory for the most recent year for which census or survey data is available. The data is presented for urban, rural and total populations. Groundwater point sources include protected and unprotected wells and springs, as well as tube wells and boreholes. Countries may have slightly different nomenclature for the above terms, but these are harmonised in the country tables produced by the JMP.
It is important to note that the data only includes point sources. Water that is bought from vendors, sold in bottles/sachets or transmitted in pipes may also originate from groundwater, but this information is not generally collated by the censuses or surveys and thus cannot be reflected. Consequently, the actual dependency of a particular on groundwater for drinking may be considerably higher. In addition, national governments may also make calculations based on the infrastructure available and assumed number of users per source. Due to the different methods of data collection and calculation, these estimates may differ from that collected by the household survey or census.
Please note that the analysis below has not been peer-reviewed, and so if you are intending to use the data, please do check in the respective JMP country file. You can access Country Files on: https://washdata.org/data. Click on map to select country, download “Country file” and open the “Water Data” tab. In case you spot any mistakes in the table below, please respond in the comments in the blog below or contact the author directly, via rwsn@skat.ch.
Table 1 Groundwater point source as main drinking water source (% of the population classified as urban, rural and total)
Urban
Rural
Total
Country
Census/ Survey Year
Ground-water point source as main drinking water source (% of the urban pop.)
Census/ Survey Year
Ground-water point source as main drinking water source (% of the rural pop.)
Census/ Survey Year
Ground-water point source as main drinking water source (% of the total pop.)
Afghanistan
2017
57.3%
2017
71.5%
2017
68.1%
Albania
2012
6.4%
2012
14.7%
2012
10.2%
Algeria
2013
6.6%
2013
19.6%
2013
11.3%
American Samoa
2010
0.5%
Andorra
2005
6.6%
Angola
2016
17.7%
2016
43.0%
2016
26.8%
Anguilla
2009
0.7%
2009
0.7%
Antigua and Barbuda
2011
0.4%
Argentina
2013
9.1%
2010
37.7%
2010
15.0%
Armenia
2016
0.1%
2016
2.6%
2016
1.1%
Aruba
2010
1.3%
Australia
2013
0.1%
2013
1.1%
2013
0.5%
Azerbaijan
2017
0.1%
2017
12.1%
2017
5.4%
Bahamas
2010
2.9%
Bahrain
1995
1.4%
Bangladesh
2016
66.4%
2016
94.7%
2016
84.9%
Barbados
2010
0.1%
2012
0.1%
Belarus
2012
2.7%
2012
32.9%
2012
11.1%
Belize
2016
0.3%
2016
4.1%
2016
2.5%
Benin
2014
39.4%
2014
56.8%
2014
48.9%
Bhutan
2017
0.3%
2017
0.6%
2017
0.5%
Bolivia (Plurinational State of)
2017
5.0%
2017
42.2%
2017
16.5%
Bosnia and Herzegovina
2012
3.6%
2012
11.4%
2012
8.9%
Botswana
2017
0.1%
2017
14.9%
2017
5.3%
Brazil
2017
0.4%
2017
8.4%
2017
1.6%
British Virgin Islands
2010
1.9%
Brunei Darussalam
2011
0.1%
2011
0.1%
2011
0.1%
Bulgaria
2001
0.4%
2001
2.7%
2001
1.1%
Burkina Faso
2017
17.1%
2017
85.6%
2017
72.9%
Burundi
2017
8.6%
2017
68.1%
2017
61.5%
Cabo Verde
2007
0.1%
2012
15.1%
2012
5.1%
Cambodia
2016
13.5%
2016
47.2%
2016
40.2%
Cameroon
2014
35.5%
2014
74.1%
2017
50.0%
Canada
2011
0.1%
2011
0.7%
2011
0.3%
Caribbean Netherlands
2001
27.3%
Cayman Islands
2010
4.9%
0.0%
2010
4.9%
Central African Republic
2010
49.1%
2010
92.1%
2010
75.4%
Chad
2015
48.0%
2015
82.4%
2015
74.6%
Chile
2017
0.6%
2017
4.0%
2017
2.4%
China
2013
7.4%
2013
43.1%
2016
22.4%
Colombia
2018
0.4%
2018
13.7%
2018
3.3%
Comoros
2012
5.1%
2012
21.3%
2012
16.2%
Congo
2015
24.9%
2015
65.7%
2015
38.3%
Cook Islands
2011
0.0%
Costa Rica
2018
0.0%
2018
0.5%
2018
0.2%
Côte d’Ivoire
2017
33.9%
2017
71.0%
2017
49.5%
Croatia
2003
3.3%
2003
18.0%
2003
20.0%
Cuba
2011
13.5%
2014
41.9%
2011
18.2%
Curaçao
2011
0.9%
Czechia
2003
1.5%
2003
7.1%
Democratic People’s Republic of Korea
2017
17.1%
2017
58.1%
2017
33.1%
Democratic Republic of the Congo
2014
33.0%
2014
79.4%
2014
63.5%
Djibouti
2017
0.6%
2017
55.5%
2017
10.9%
Dominica
2001
0.6%
2001
6.3%
2009
0.3%
Dominican Republic
2016
0.1%
2016
2.3%
2016
0.7%
Ecuador
2017
1.1%
2017
17.1%
2017
6.1%
Egypt
2017
0.4%
2017
2.1%
2017
1.4%
El Salvador
2017
3.0%
2017
12.3%
2017
6.6%
Equatorial Guinea
2011
44.7%
2011
51.9%
2011
48.4%
Eritrea
2010
3.4%
2010
36.0%
2010
24.6%
Estonia
2010
1.7%
2010
18.8%
2010
6.7%
Eswatini
2014
3.7%
2014
31.5%
2014
24.0%
Ethiopia
2017
5.1%
2017
62.3%
2017
52.0%
Falkland Islands (Malvinas)
2016
43.7%
Fiji
2014
1.1%
2014
13.6%
2014
7.2%
Finland
1999
1.0%
2005
5.0%
2005
1.0%
French Guiana
1999
5.0%
1999
6.0%
2015
13.5%
Gabon
2013
3.3%
2013
37.8%
2013
8.2%
Gambia
2013
14.4%
2013
60.0%
2013
32.6%
Georgia
2017
4.9%
2017
46.9%
2017
22.2%
Germany
2007
0.8%
2007
0.8%
2007
0.0%
Ghana
2017
11.3%
2017
56.7%
2017
36.0%
Greece
2001
0.2%
2001
3.8%
Grenada
1999
4.0%
1999
18.0%
Guadeloupe
2006
0.8%
2006
0.3%
2006
0.8%
Guam
2010
0.1%
Guatemala
2015
5.0%
2015
19.6%
2015
13.4%
Guinea
2016
32.8%
2016
75.3%
2016
59.0%
Guinea-Bissau
2014
41.0%
2014
78.0%
2014
61.7%
Guyana
2014
1.3%
2014
5.5%
2014
4.4%
Haiti
2017
8.1%
2017
56.5%
2017
37.5%
Honduras
2017
2.0%
2017
4.2%
2017
3.0%
Hungary
1990
5.0%
1990
28.9%
India
2016
23.8%
2016
63.7%
2016
50.5%
Indonesia
2018
35.2%
2018
66.9%
2018
49.6%
Iran (Islamic Republic of)
2015
1.8%
2015
4.6%
2015
0.8%
Iraq
2018
0.5%
2018
4.6%
2018
1.8%
Ireland
2006
0.0%
2006
0.5%
Italy
2001
3.9%
Jamaica
2014
0.0%
2014
1.2%
2014
0.6%
Jordan
2016
0.3%
2016
0.7%
2016
0.4%
Kazakhstan
2015
3.2%
2015
21.0%
2015
11.5%
Kenya
2017
21.2%
2017
54.1%
2017
46.2%
Kiribati
2014
0.0%
2014
0.0%
2014
0.0%
Kyrgyzstan
2014
1.1%
2014
11.3%
2014
8.1%
Lao People’s Democratic Republic
2017
9.0%
2017
46.0%
2017
34.7%
Latvia
2003
2.4%
2003
12.5%
Lebanon
2016
10.9%
Lesotho
2015
5.5%
2015
27.8%
2015
21.4%
Liberia
2016
58.7%
2016
74.7%
2016
65.3%
Libya
1995
35.8%
1995
26.9%
2014
19.1%
Madagascar
2016
24.5%
2016
61.6%
2016
57.6%
Malawi
2017
16.3%
2017
86.0%
2017
73.8%
Malaysia
2003
0.8%
2003
6.7%
Maldives
2014
0.1%
2014
0.2%
2017
0.5%
Mali
2018
19.5%
2018
72.3%
2018
56.2%
Marshall Islands
2017
0.2%
2017
2.5%
2017
0.6%
Martinique
1999
0.5%
2015
0.4%
Mauritania
2015
6.5%
2015
49.4%
2015
29.1%
Mayotte
0.0%
2013
2.5%
Mexico
2017
0.8%
2017
9.5%
2017
2.8%
Micronesia (Federated States of)
2010
3.6%
2010
10.7%
2010
9.1%
Mongolia
2016
12.8%
2016
52.7%
2016
25.8%
Montenegro
2013
5.1%
2013
29.2%
2013
14.1%
Montserrat
1998
2.0%
1998
100.0%
2001
0.1%
Morocco
2012
1.0%
2012
27.2%
2012
10.2%
Mozambique
2015
21.4%
2015
62.5%
2015
49.6%
Myanmar
2016
34.3%
2016
74.8%
2016
64.0%
Namibia
2016
0.6%
2016
23.4%
2016
11.8%
Nauru
2011
1.6%
2011
0.0%
2011
1.6%
Nepal
2016
41.8%
2016
46.8%
2016
44.4%
New Caledonia
2014
3.1%
Nicaragua
2014
4.4%
2014
59.9%
2016
21.4%
Niger
2017
33.9%
2017
71.0%
2017
49.5%
Nigeria
2018
45.3%
2018
73.1%
2018
60.0%
Niue
1999
20.0%
2010
0.0%
North Macedonia
2011
1.5%
2011
15.1%
2011
7.7%
Northern Mariana Islands
2000
1.3%
0.0%
2010
1.1%
Oman
2014
5.1%
2014
10.0%
2014
6.4%
Pakistan
2016
30.4%
2016
44.0%
2016
39.1%
Panama
2015
0.7%
2015
14.6%
2017
0.0%
Papua New Guinea
2017
2.8%
2017
7.5%
2017
7.1%
Paraguay
2017
2.1%
2017
9.2%
2017
4.8%
Peru
2017
1.5%
2017
11.1%
2017
3.8%
Philippines
2017
8.4%
2017
37.6%
2017
23.9%
Portugal
2001
0.1%
2001
0.7%
Puerto Rico
1995
1.8%
Republic of Korea
2015
1.0%
Republic of Moldova
2012
16.9%
2012
65.1%
2012
47.1%
Réunion
2015
0.2%
Romania
1994
11.3%
1994
81.0%
Russian Federation
2009
3.4%
2009
19.5%
2009
8.6%
Rwanda
2017
17.2%
2017
58.4%
2017
50.4%
Saint Kitts and Nevis
1999
27.0%
1999
27.0%
2007
0.3%
Saint Lucia
2012
0.5%
2012
2.0%
2012
1.6%
Saint Vincent and the Grenadines
1999
20.0%
2012
0.1%
Samoa
2016
2.6%
2016
5.6%
2016
5.0%
Sao Tome and Principe
2010
4.5%
2010
11.7%
2010
6.9%
Saudi Arabia
2017
0.2%
Senegal
2017
7.2%
2017
35.0%
2017
22.5%
Serbia
2014
2.4%
2014
11.7%
2014
6.2%
Sierra Leone
2017
54.7%
2017
68.9%
2017
62.6%
Sint Maarten (Dutch part)
2011
7.4%
Slovakia
2003
2.3%
2003
2.3%
2011
13.1%
Solomon Islands
2015
8.6%
2016
27.6%
2015
17.5%
Somalia
2017
9.5%
2017
60.5%
2017
34.1%
South Africa
2017
0.5%
2017
10.1%
2017
3.8%
South Sudan
2017
66.5%
2017
80.1%
2017
77.3%
Spain
2003
0.6%
2003
0.3%
Sri Lanka
2016
17.3%
2016
51.0%
2016
45.3%
Sudan
2014
2.2%
2014
13.2%
2014
9.8%
Suriname
2017
3.1%
2017
5.4%
2017
3.8%
Syrian Arab Republic
2018
4.2%
2018
11.6%
2018
8.4%
Tajikistan
2017
5.2%
2017
18.7%
2017
15.4%
Thailand
2016
1.8%
2016
6.2%
2016
4.2%
Timor-Leste
2016
20.0%
2016
33.6%
2016
29.9%
Togo
2017
36.6%
2017
61.2%
2017
51.8%
Tonga
1999
28.0%
1999
24.0%
1996
1.7%
Trinidad and Tobago
2011
0.9%
2011
1.0%
2011
0.9%
Tunisia
2015
0.5%
2015
10.8%
2015
3.7%
Turkey
2013
5.0%
2013
40.0%
2013
13.0%
Turkmenistan
2016
4.4%
2016
34.3%
2016
22.6%
Turks and Caicos Islands
1999
22.0%
1999
40.0%
2012
1.7%
Tuvalu
2007
1.7%
2007
0.5%
2007
1.1%
Uganda
2017
35.8%
2017
79.6%
2017
71.9%
Ukraine
2018
11.5%
2018
61.2%
2018
27.8%
United Arab Emirates
2003
0.2%
2018
0.1%
United Republic of Tanzania
2017
19.4%
2017
50.5%
2017
41.2%
United States of America
2015
3.0%
2015
45.2%
2015
11.1%
Uruguay
2017
0.0%
2017
3.1%
2017
0.2%
Uzbekistan
2015
6.9%
2015
22.7%
2015
14.2%
Vanuatu
2016
1.6%
2016
4.8%
2016
4.0%
Venezuela (Bolivarian Republic of)
2011
4.3%
2011
25.6%
2011
6.8%
Viet Nam
2016
19.5%
2016
57.2%
2016
45.2%
West Bank and Gaza Strip
2017
1.2%
2017
3.2%
2017
1.5%
Yemen
2013
2.3%
2013
43.1%
2013
31.6%
Zambia
2015
26.7%
2015
76.8%
2015
55.8%
Zimbabwe
2017
11.1%
2017
77.5%
2017
57.0%
Photo: Groundwater provides over 80% of the rural population with its main source of drinking water in South Sudan. Photo taken in 2014 in Northern Bahr el Ghazal by Kerstin Danert.