This is a guest blog by Kenneth Alfaro Alvarado about our new RWSN member organisation Red de Jóvenes por el Agua Centroamérica (Youth Water Network for Water Central America) and its activities at LatinoSan in April 2019, which were supported by RWSN. For more information on RWSN’s support for Young Water Professionals, please see here.
From April 1-5 2019, the Red de Jóvenes por el Agua Centroamérica (Youth Network for Water in Central America, also known as RJxA CA) held a Water and Sanitation Week in Costa Rica, which included our participation on the 5th Latinosan Conference and our 3rd Regional Meeting.
RJxA CA is a regional platform with representation in Costa Rica, Nicaragua, Panamá, Honduras, El Salvador, Guatemala, and Belice. Our network promotes the involvement of young people in Integrated Water Resources Management, by strengthening the capacities of young people, political advocacy, environmental education and volunteering. We are also committed to the realisation of the Sustainable Development Goals, especially SDG6. In the network, each country has its own working areas; in Costa Rica, the focus is on Rural Water Supply and Management.
Activities at the 5th LatinoSan conference
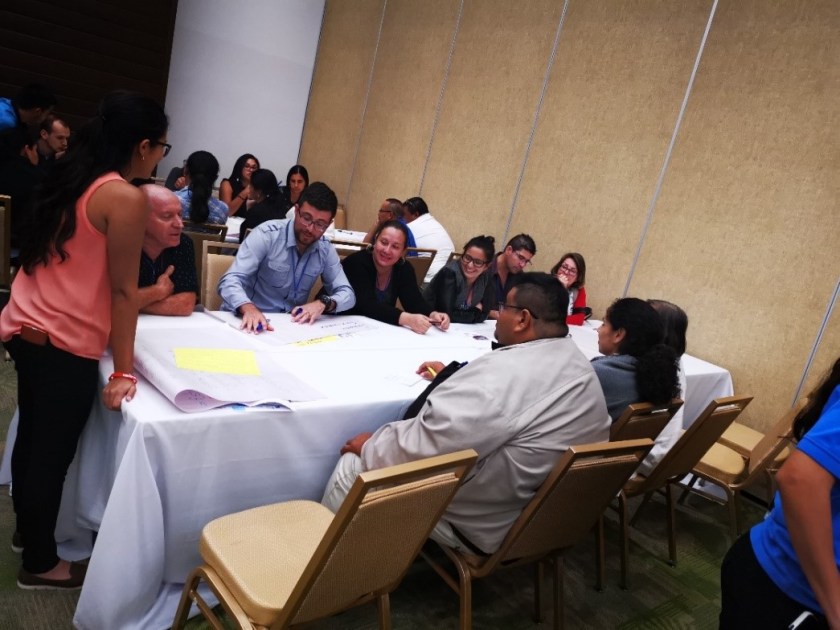
During the first day of Latinosan, we had the opportunity to meet and exchange experiences with a group of representatives from the Rural Water Supply and Management sector. We encourage the involvement of young people in the rural water supply and sanitation sector; some of our members are leaders in this sector.
Youth members of the RJxA CA network and Rural Water Supply Managers. Photo credit: Kenneth Alfaro
During the second day , we organised a session dedicated to “Young Professionals of Sanitation” that I had the opportunity to moderate, thanks to the support of the Costa Rican Institute of Aqueducts and Sewerage (AyA) and COSUDE. We listened to the experiences of 4 young people from Costa Rica, Guatemala, Honduras and Perú, all of them working and implementing projects in the rural sanitation sector.
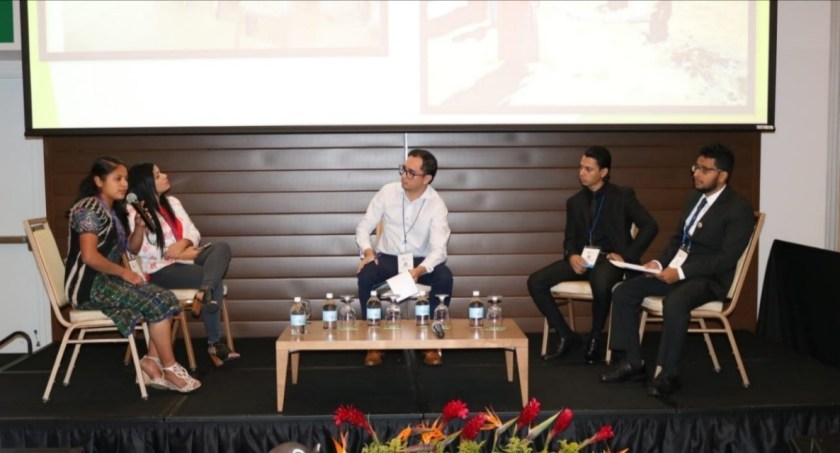
Panelists at the Young Professionals of Sanitation session. Photo credit: Douglas Montano
We also supported the session “Community management of water and sanitation as a model for accelerating the closing of the urban-rural divide” organized by the Avina Foundation and the Latin American Confederation of Community Organizations for Water and Sanitation Services (CLOCSAS) ; we facilitated a workshop using the “World Café” methodology in order to extract ideas from the participants. Some of the main ideas that emerged from the session included the need to improve communications with all institutions, that funds for projects be better administrated, and to take into account spatial aspects in order to better plan for the future use of water.
Discussions during the session “Community management of water and sanitation as a model for accelerating the closing of the urban-rural divide” . Photo credit: Kenneth Alfaro
Activities during the 3rd Regional Meeting and 2nd National Costa Rica Encounter of the Youth Network for Water Central America
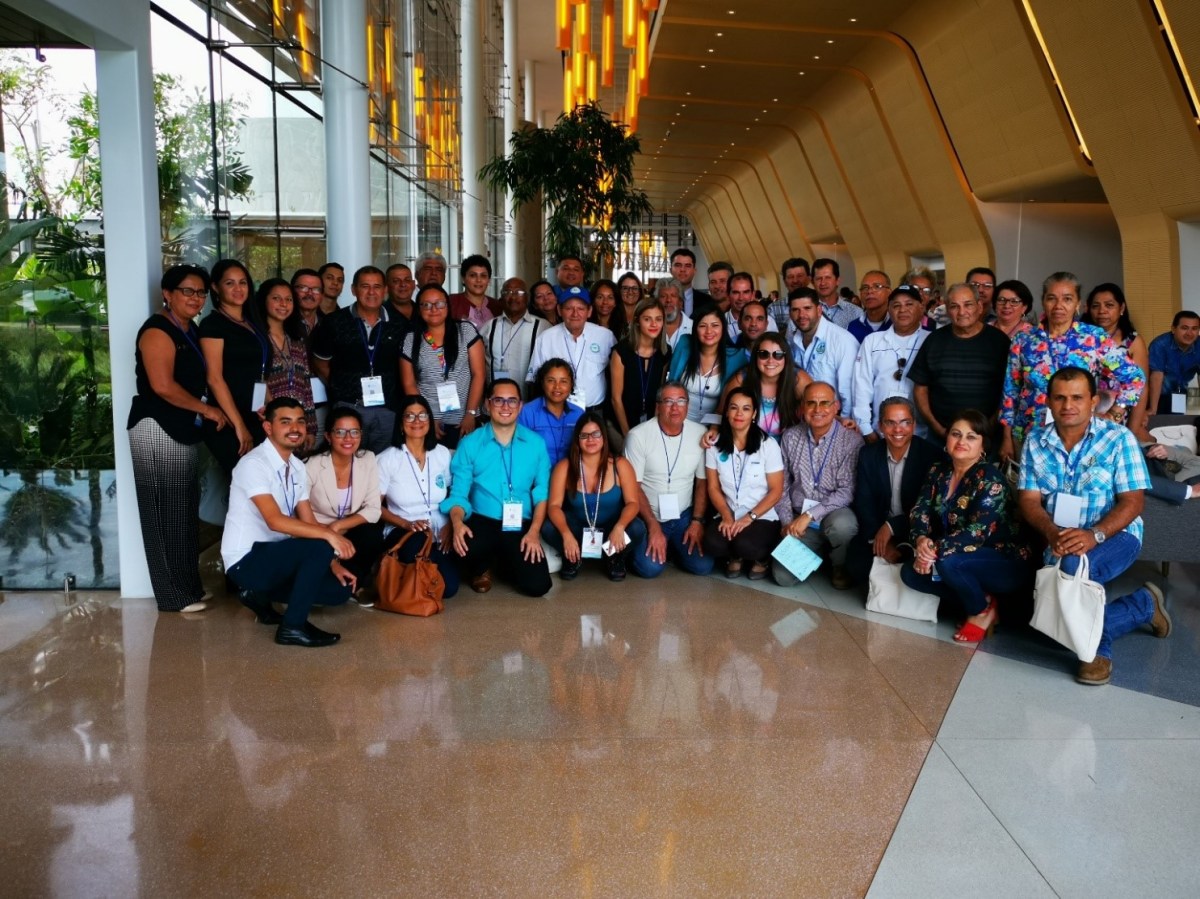
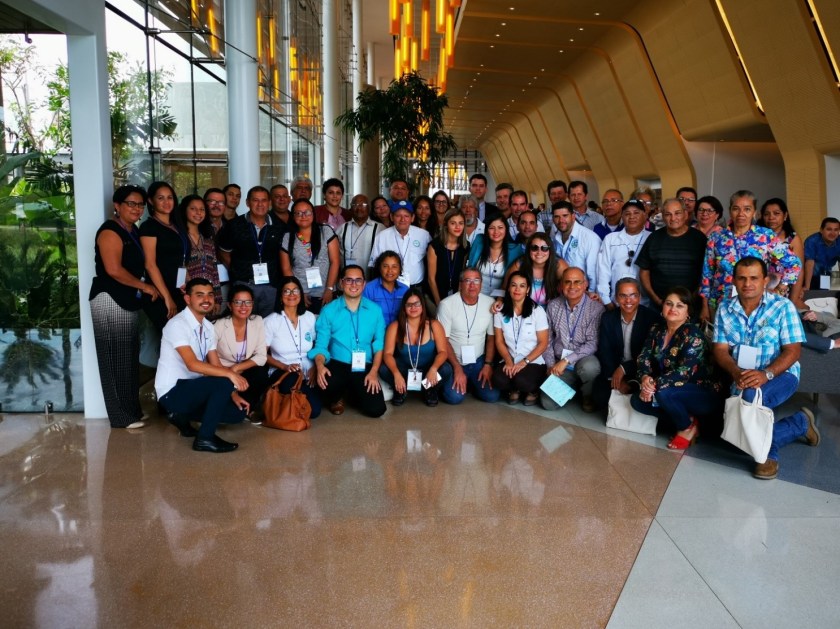
The 3rd Regional Meeting was held at the National University of Costa Rica, located in the province of Heredia, with the participation of more than 130 young people from over Central America and other Latin American countries on April 4th, 2019.
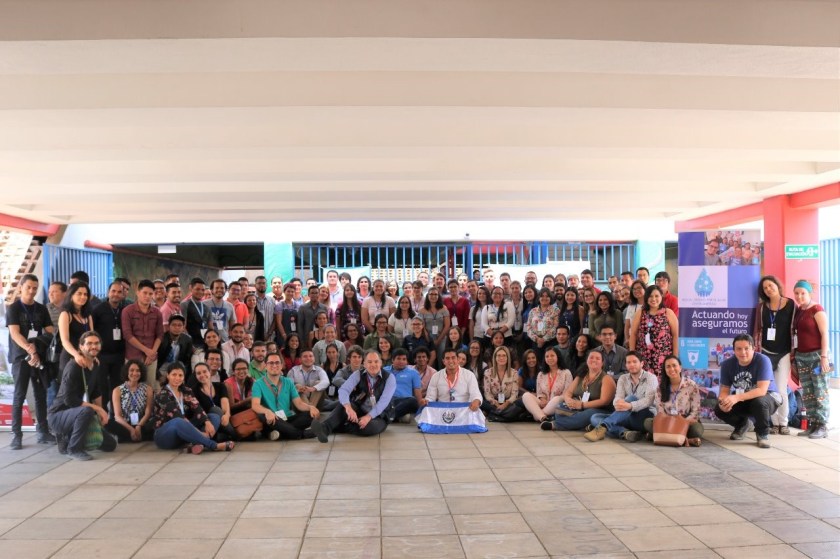
Group photo of the 3rd Regional Meeting and 2nd National Encounter of Costa Rica of the Youth Network for Water Central America. Photography: Kenneth Alfaro
This event begun with a panel called “Youth and Community Water Management“, moderated by Geisel Sánchez, national coordinator of Costa Rica. The panel included the participation of Karen Guzmán (administrator of the Sierpe Rural Aqueduct in the Osa region, Puntarenas), Ricardo González Chávez (administrator of the Rural Aqueduct of El Mora de Turrialba, Cartago), Gabriel Villalobos and Mónica Romero (members of the Board of Directors of the Milano Rural Aqueduct in Siquirres, Limón), and Dariana Dávila, of Honduras. All are leaders in their communities and with their experiences, they sent a message of motivation to those present, about the need for young people to get involved in community processes and to contribute from their experience, enthusiasm and ideas to the gaps in the management of drinking water in the country and in the Central American region.
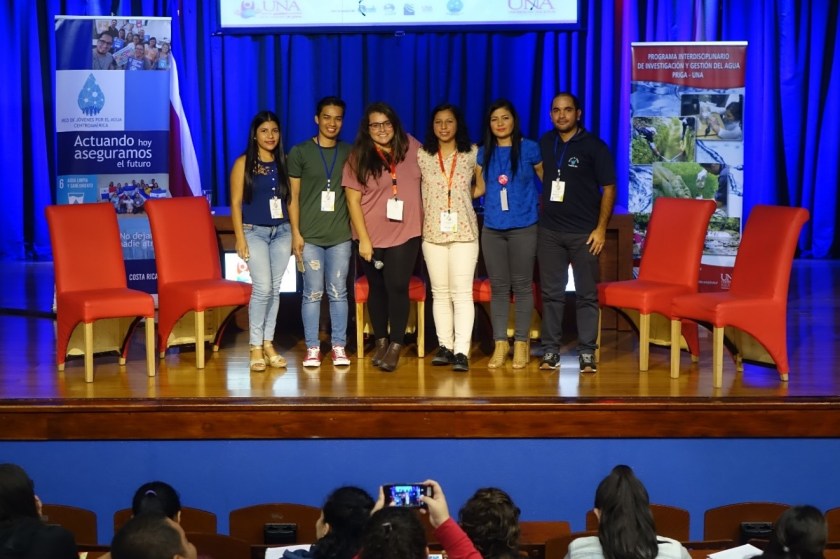 Opening panel participants. Photo credit: Douglas Montano
At the end of the day, we read and approved our youth declaration, which was built based on the results of a Virtual Consultation we conducted in march 2019. The Declaration on “Youth Acting for Sanitation to Not Leave Anyone Behind” was adhered to by 190 young people.
We call upon governments to act upon the following three most important requests:
- To implement spaces of participation for all civil society sectors, including youth, as actors in decision-making.
- To implement accountability mechanisms that must be accessible, inclusive and transparent to allow us to measure the fulfillment of the SDG6. These mechanisms should be consulted and validated to ensure their relevance and efficiency.
- To strengthen Community Organisations of water and sanitation services in every country because they play an important role in ensuring drinking water and basic sanitation, especially in rural areas.
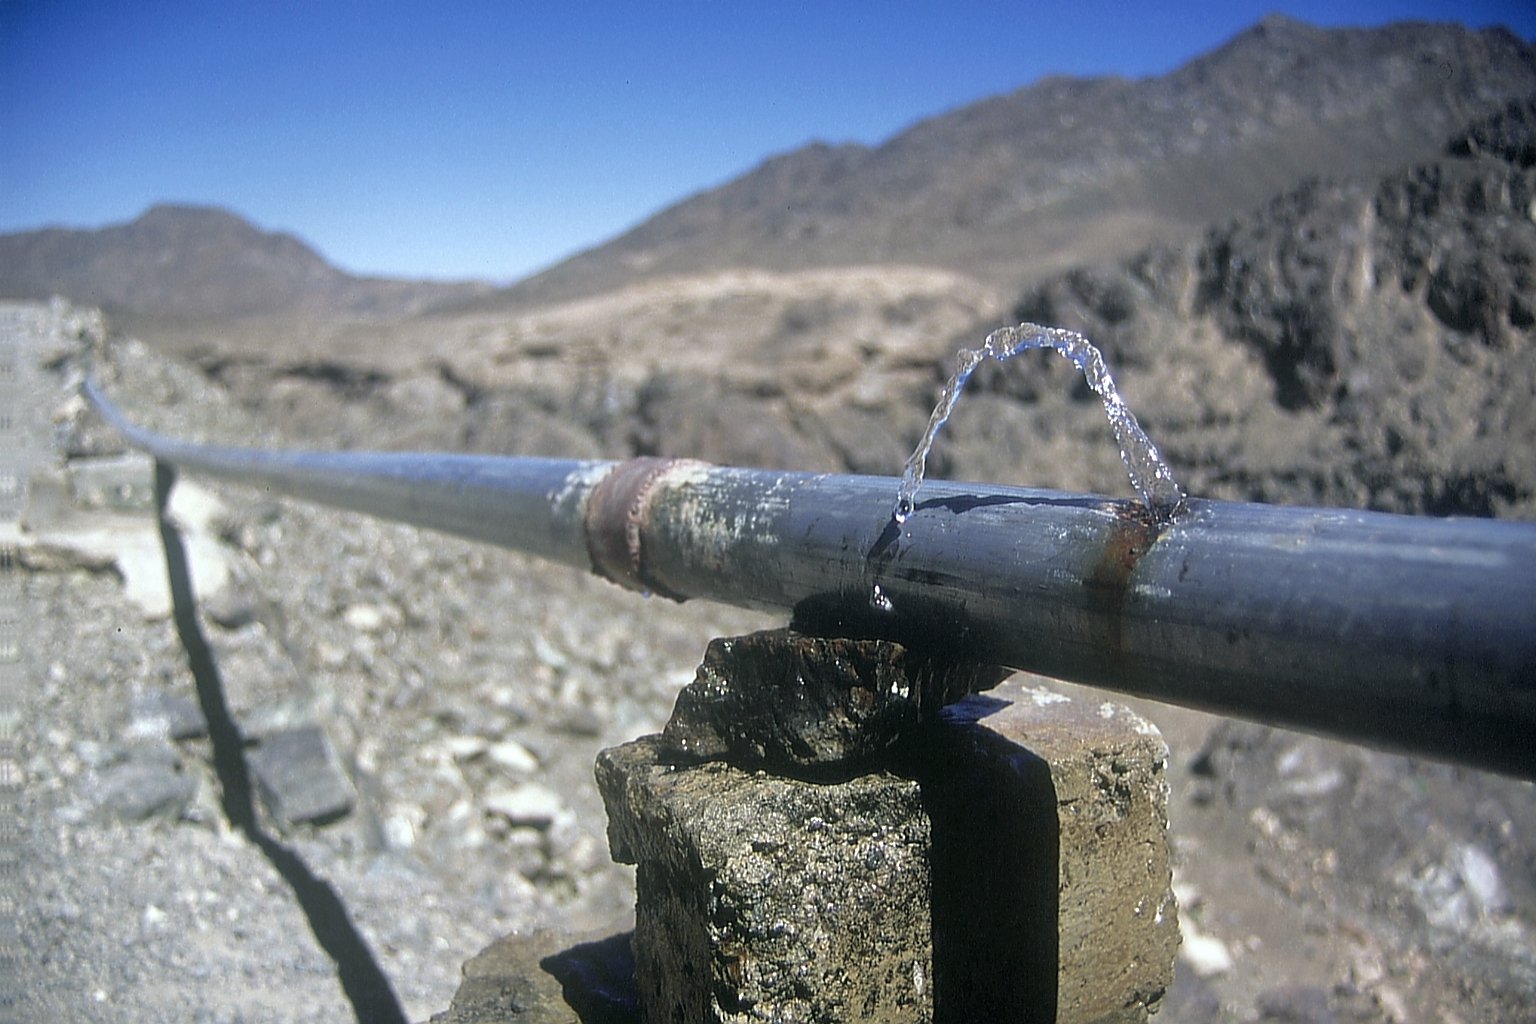
Tour to the San José de la Montaña Communal Aqueduct
As part of the 3rd Regional Meeting, we wanted a group of young people to learn about the experience of community water management in Costa Rica, where the Communal Aqueducts supply more than one million people and account for almost 30 % of the administration and management of water supply throughout the country. On April 5th, a visit was organized to the Rural Aqueduct San José de la Montaña, Heredia where young people learned about its operation, water sources and infrastructure, the actions they carry out to protect the water resource and the plans they have for the community with their environmental education programme.
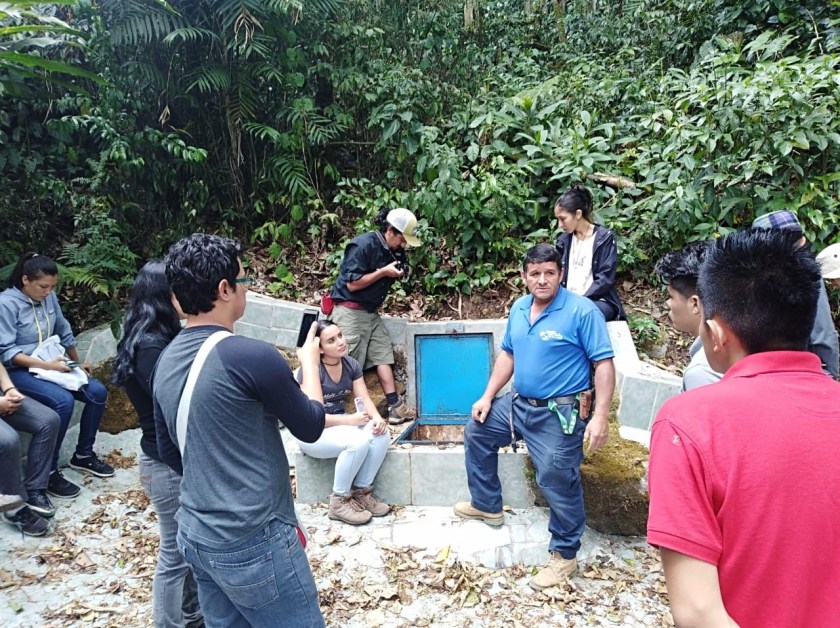
Tour to San José de la Montaña Rural Aqueduct. Photo credit: Jason Salgado.
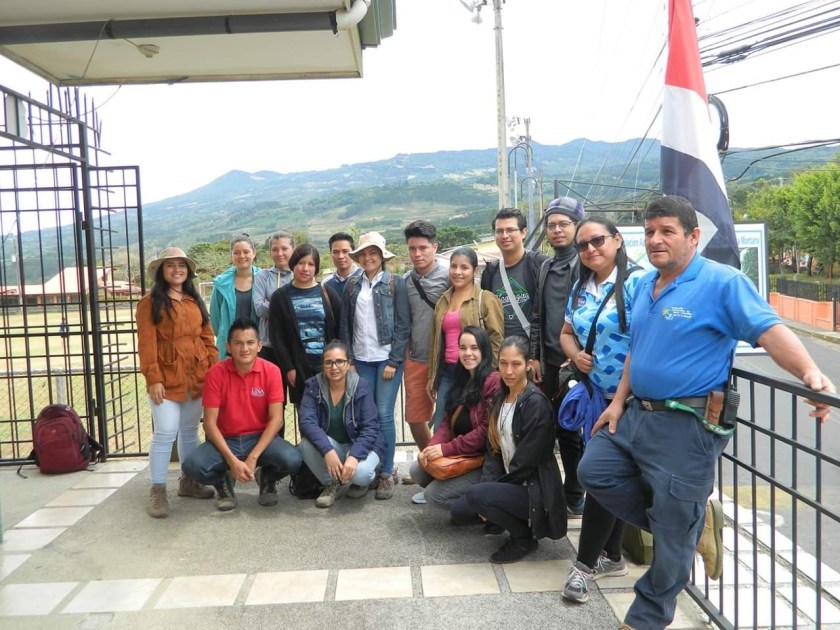
Tour to San José de la Montaña Rural Aqueduct. Photo credit: Jason Salgado.
After this week, our commitment to work and support the empowerment of young people in the rural water sector is even bigger.
About the author
Kenneth Alfaro Alvarado is an Environmental Engineer, and Coordinator of the Youth Network for Water Central America in Costa Rica. The Youth Water Network for Water Central America is a RWSN member organisation. Find out more about the network here.
Contacts:
- Twitter: https://twitter.com/KennethAMB
- Email: coordinacion.cr[at]rjxaca.org
- Facebook: https://www.facebook.com/jovenesxagua/